| Corcoran Technical Trading Patterns For October 31 |
| By Clive Corcoran |
Published
10/31/2008
|
Stocks
|
Unrated
|
|
|
|
Corcoran Technical Trading Patterns For October 31
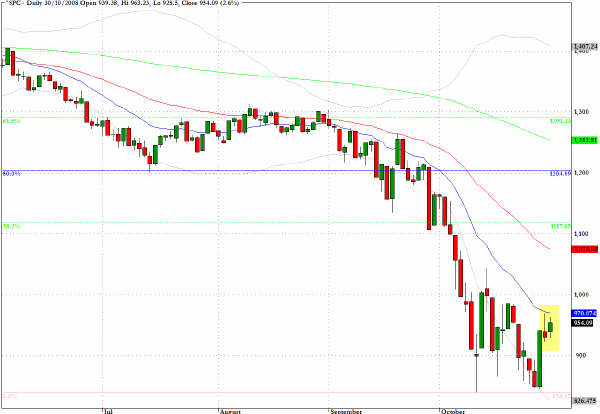
The S&P 500 (^SPC), despite a decent upward move of 2.6%, still registered an inside day as it failed to take out Wednesday's intraday high which lies exactly on the 20-day EMA.
Today is the last day of what has been a very destructive month for those on the long side of most asset classes, and, as we move into November, there could be some relief that seasonal factors may be more supportive for the equities as we approach Thanksgiving.
I have very little feel for the near-term direction but during November I would not be surprised to see the S&P 500 reaching up towards the 1070 level.
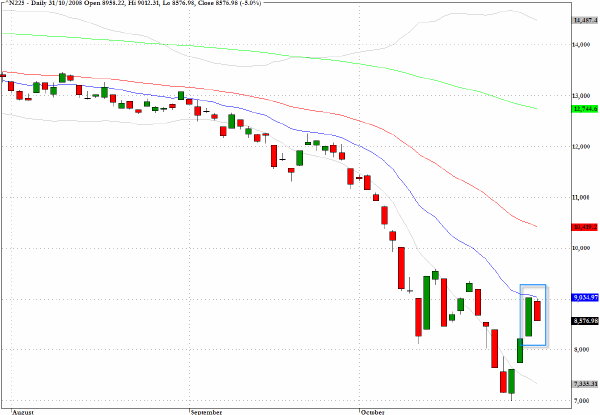
The Bank of Japan followed the lead of the Federal Reserve and reduced its key short term rate from 0.5% to 0.3%. The result was a five percent selloff, most of which occurred in the afternoon session in Tokyo, and was attributed to the notion that many traders were disappointed that the cut was not more substantial.
When you are talking about only 30 basis points to zero this is a rather bizarre argument. Also notable on the chart is the inside day pattern which echoes that seen on several of the US indices in Thursday's trading.
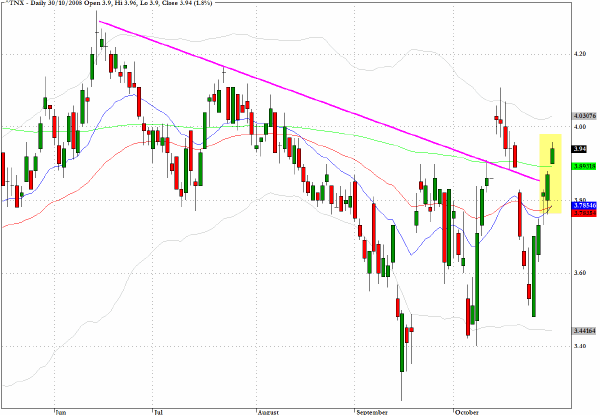
I noted yesterday in my comments on the yield of ten-year Treasury notes that a key trendline through the highs in terms of yields has now been penetrated twice in recent weeks and that the current challenge could be more sustainable. Yields continued higher yesterday and a 4% target seems to be imminent.
Apropos the concerns I expressed yesterday about the magnitude of the global bailout efforts, the one thing that will keep in check the upward pressure on yields is the omnipresent possibility of a return to the safe haven play if equities come under renewed pressure on the downside.
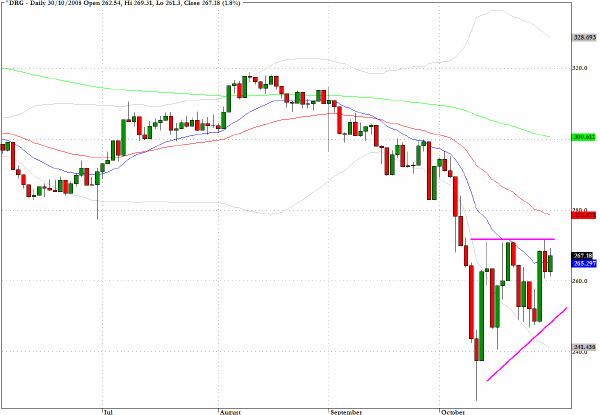
The evolving pattern on the Amex Pharmaceuticals Index (^DRG) looks constructive and suggests that a continuing accumulation is taking place.
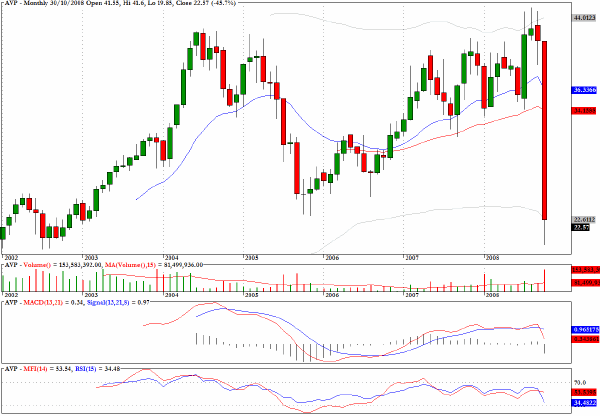
The monthly chart for Avon Products (AVP) is quite remarkable in showing that all of the upward progress that this stock has made since the lows of 2002 and 2003 has almost been erased in just the single month of October 2008.
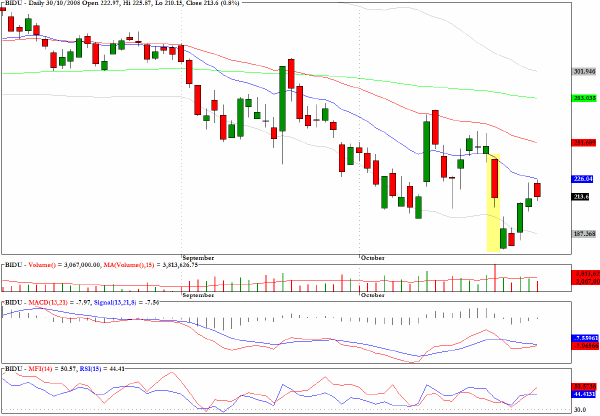
Baidu (BIDU) has rallied back in a flag-like formation that could be ripe for a sudden setback as it encounters the 20-day EMA.
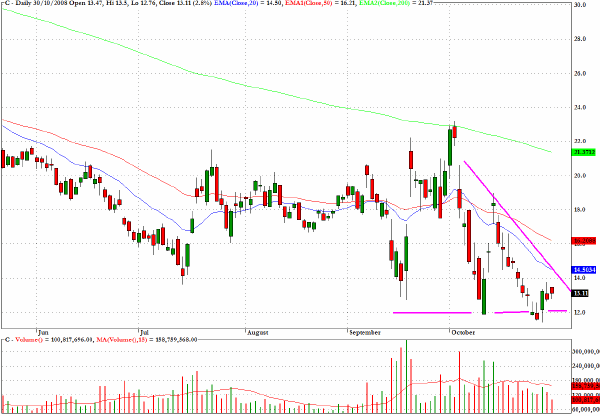
Citigroup (C) is still struggling near multi-year lows and the chart pattern is suggesting that there is still considerable scepticism that this stock is a screaming buy at current levels.
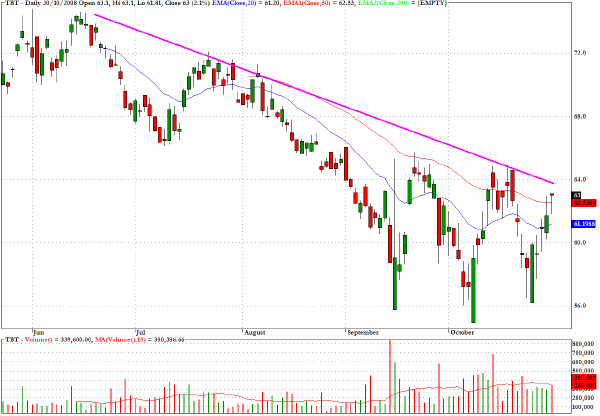
The chart for the exchange traded fund TBT would be a vehicle for those who are bearish on the eventual direction of long-term Treasuries. This is not a short term trading suggestion but rather one that could be held for the intermediate term.
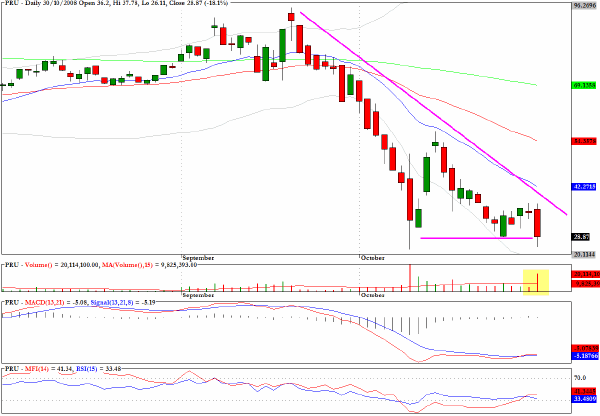
Prudential (PRU) closed exactly at a critical level in regards to a descending wedge pattern. There was very substantial volume on the move in yesterday's trading, and this raises concerns that there could be a new leg down in this major financial intermediary.
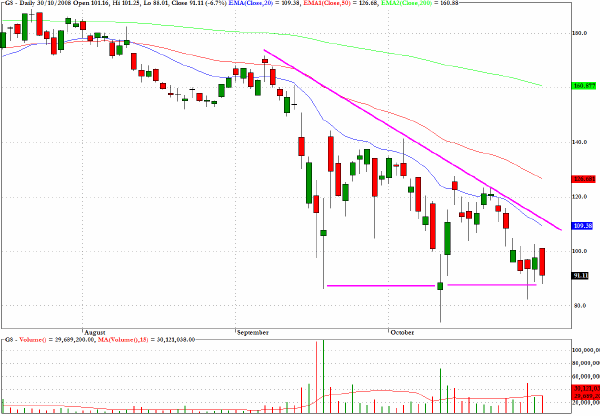
The chart for Goldman Sachs (GS) reinforces the view that I have expressed several times that for even the most blue chip names in the financial services there needs to be a fundamental re-thinking of their long-term value.
The rugged individualist world of investment banking is over and for Goldman there is the specter of much less dynamic growth potential of such firms for investors to worry about rather than the more recent concerns about their solvency.
Clive Corcoran is the publisher of TradeWithForm.com, which provides daily analysis and commentary on the US stock market. He specializes in market neutral investing and and is currently working on a book about the benefits of trading with long/short strategies, which is scheduled for publication later this year.
Disclaimer
The purpose of this article is to offer you the chance to review the trading methodology, risk reduction strategies and portfolio construction techniques described at tradewithform.com. There is no guarantee that the trading strategies advocated will be profitable. Moreover, there is a risk that following these strategies will lead to loss of capital. Past results are no guarantee of future results. Trading stocks and CFD's can yield large rewards, but also has large potential risks. Trading with leverage can be especially risky. You should be fully aware of the risks of trading in the capital markets. You are strongly advised not to trade with capital.
|