| History Shows Gains Ahead For Stock Market |
| By Price Headley |
Published
11/1/2008
|
Currency , Futures , Options , Stocks
|
Unrated
|
|
|
|
History Shows Gains Ahead For Stock Market
October remains to be the scariest month in stocks with the onset of the Great Depression, the 1987 Crash, and now the 2008 Credit Crisis. With such historic stock market events we need a better perspective for the months ahead. Based on history, are we more, or less likely to gain before year end? And over what time periods will we see weakness return. Traders often look at the trees, instead of the forest-we looked at the forest and found compelling data to help gauge where we go from here. We looked at monthly and quarterly data from the Dow Jones Industrial Average; we looked at the top 10 worst monthly declines and consecutive quarterly losses to project likely outcomes for the rest of 2008 and beyond.
If the last ten years weren't enough to make you a trader, I'm not sure what will. In the last year we saw gains disintegrate taking investors and the market back to 1998. Alternatively traders, during that time, capitalized on the ups and downs of the market and were finally vindicated for the hard work and dedication.
The next ten years may not be so different. Unless macro inventions like the personal computer (1980s savior) or the monetization of the internet (1990s savior) arrive, the rest of this decade may be characterized with slow or negative growth. The message is clear it's not a buy and hold market anymore; it's a trader's market!
That being said, let's talk about current trading opportunities, specifically over the next three to six months. To fully understand the implications of October's market slide, we looked at the top 10 monthly percentage losses in the DJIA.
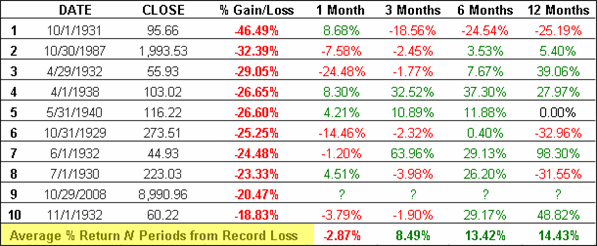
Top 10 Monthly Losses in Dow Jones Industrial Average

First off, notice that based on historical standards and percentages the current month of losses barely makes it into the top 10-things could or can get worse. On the other hand, we are likely to see gains over the next 3, 6, and 12 months from the close of the end of the record monthly loss. There is a bias to the 1930s era when looking at the top 10 losses, however the 1987 trends are similar to the average--short-term losses will continue but a shallow recovery will emerge within a year.
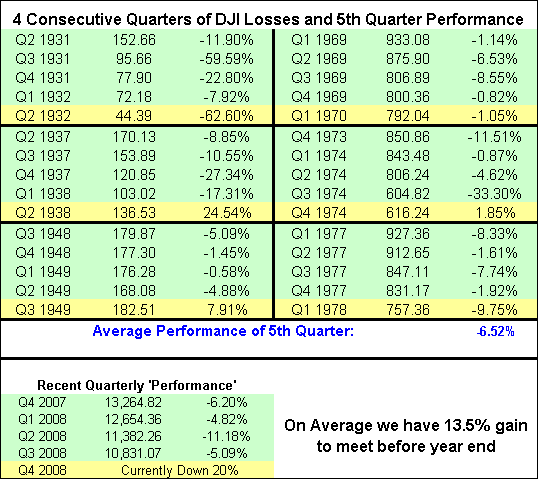
You may not realize this, but Q3 2008 marked the fourth consecutive quarter of declining market value, it all started at this time last year. This streak of losses has only occurred six times since 1920-so the market has only endured four straight quarterly losses six times in 90 years. What generally happens in the following quarter? This data is not as biased towards the 1930s and may shed better light on our current situation. Here's a quick summary of those six occurrences:

On average, traders can expect market gains for the remainder of 2008, doesn't that sound nice? Specifically, we can expect a 10-15 percent gain between now and year end based on the quarterly analysis. Additionally, based on the top ten monthly losses we can expect marginal losses in November and solid gains in December and January (3 months later). By aggregating the information the case for the bulls is even more powerful, but the bearish case is NOT closed. It is almost certain that volatility will continue to be front and center, which will foster an environment fit for traders.
Price Headley is the founder and chief analyst of BigTrends.com.
|