| Outlook On The Stock Indices |
| By Price Headley |
Published
11/2/2008
|
Stocks
|
Unrated
|
|
|
|
Outlook On The Stock Indices
NASDAQ Composite
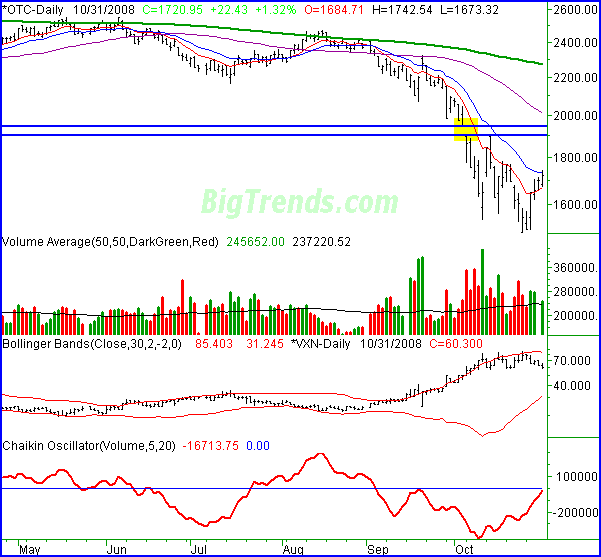
On Friday, the NASDAQ was up 22.43 points (+1.32%), to end the session at 1720.95. On a weekly basis, that meant a gain of 168.92 points (+10.88%).
We're going to devote most of our time to the S&P 500 this week, since it's essentially a proxy for the overall market. However, a few notes about the NASDAQ.
Last week was nice, but it's been the combination (net) of the last three weeks that's left the composite in a position to do something important this week, which was to close above the 20-day moving average line of the first time since August. We're barely above a break-even for the last three weeks, but it's clearly not indiscriminate selling anymore.
The last line we'll draw in the sand for the composite is 1770, or the high from three weeks ago. If we can get above that line, several more potential buyers will be encouraged.
As for how far that move might carry us, we believe at least up to 1947; that's where the bearish gap level is from October 6. We may even be able to move above that mark though. We'll talk about that when the time comes.
NASDAQ Composite Chart - Daily

S&P 500
The close of 876.75 on Friday was the result of the S&P 500's 3.45% dip (-31.35 points). For the week, the large cap index was lower by 6.78% (-63.8 points). Despite the loss though, we may have seen an important support line come into focus.
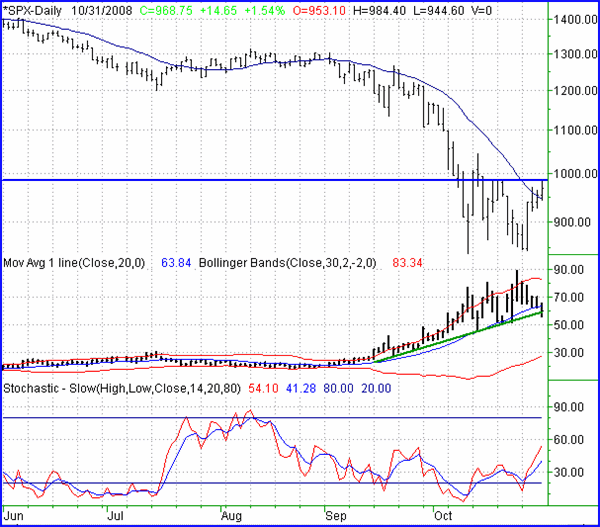
The 1.55%/+14.65 point rally for the S&P 500 on Friday led the large cap index to a close of 968.75. That was 10.49%/92 points better than the prior week's close.
Like the NASDAQ, the SPX closed above its 20-day moving average line for the first time in a long time too. We interpret that as an indication that momentum has shifted. That's not the only clue though. We've also watched the VIX fall under its 20-day moving average line as well as fall under a key intermediate-term support line. Both suggest there's a lot of room for the market to recover from current levels.
The only challenge we see is a resistance line right at 985. The SPX peaked there on Friday, but also peaked there a couple of weeks ago. We'd really lime to see the index ge above that level first before getting too bullish. If to does though, we don't think a move back up to August's highs around 1300 is out of the question.
In the interest of safety, we'd also like to draw a support line at 926, where the 10-day moving average line is. That may not be quite enough room to accommodate all the recent volatility though, so it's only a suggestion. The ultimate support line is still at 847.
S&P 500 Chart - Daily

Dow Jones Industrial Average
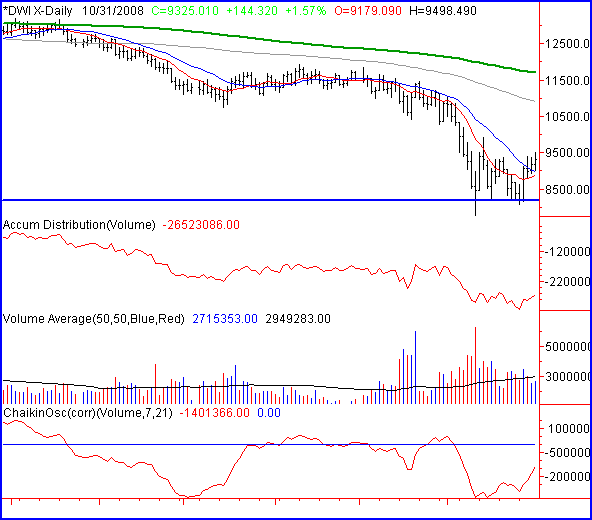
The Dow rallied 144.32 points (+1.57%) on Friday to end the day at 9325.01. For the week, the blue chip index gained 946.06 points (+11.29%) -- most of it on Tuesday. Still, that makes the Dow the big winner for the week. In fact, the Dow is the only major index to break past recent highs. So, there's not really a meaningful resistance line to talk about here.
There is one very bullish thing we saw for the Dow that also applies to the NASDAQ Composite (the data isn't available for the S&P 500). That clue is volume -- lots of buying volume, and not much selling volume. The Chaikin line and the accumulation-distribution line for both charts are both pointing to an inflow of buyers. That in itself isn't a reason to start buying. But, when combined with other factors in the current situation, we know that the bullish effort isn't hollow.
Dow Jones Industrial Average Chart - Daily

Price Headley is the founder and chief analyst of BigTrends.com.
|