| Corcoran Technical Trading Patterns For November 3 |
| By Clive Corcoran |
Published
11/3/2008
|
Stocks
|
Unrated
|
|
|
|
Corcoran Technical Trading Patterns For November 3
The 50-day EMA levels are looking increasingly feasible on many charts for individual stocks and indices.
Some readers of the commentary have commented that the charts that I have recently been showing for sectors and stocks are not currently including the MACD and MFI chart segments. The primary reason for omitting them at present (I do intend to return to them very soon) is the fact that the events of the second half of October were so unprecedented as to seriously undermine the reliability of the technical analysis applied to these indicators. The distances that most closing prices reached from the standard moving averages and the degree of selling rendered the usual interpretations of money flow, divergences and momentum effectively useless.
We are now in a snapback mode where the path of least resistance is clearly upwards and even those who are still ultimately forced sellers are waiting for more opportune moments to pull the plug. There is a window this week prior to the release of the employment report on Friday when there should be a good bid under the market, and where late sell-offs as seen last Friday, could be indications that yet another hedge fund got out on better terms than it would have done at the height of the recent liquidations.
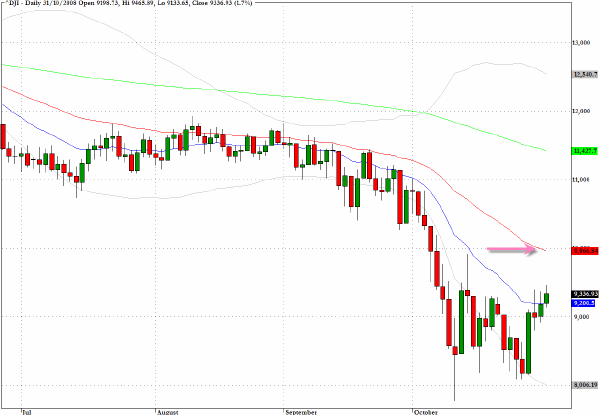
The DJIA looks as though it will try to re-attain the intraday high from October 14 and the 10,000 level could even be on the radar screens before Friday's data.
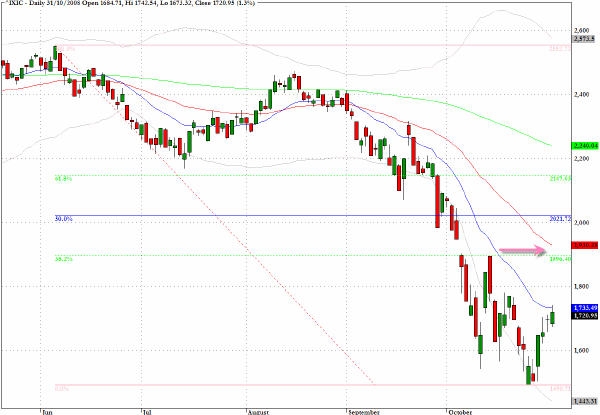
An even more convincing case can be made that a strategic level for the Nasdaq Composite (^IXIC) - 1900 - is a feasible target during the coming weeks. The 50-day EMA and the 38% retracement of the early June high down to the October low can be found in this vicinity.
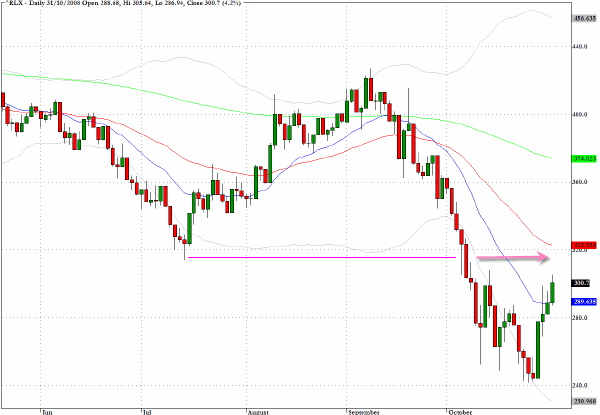
The S&P Retail Index (^RLX) also faces a clear upside target and area of strong resistance at the 320 level.
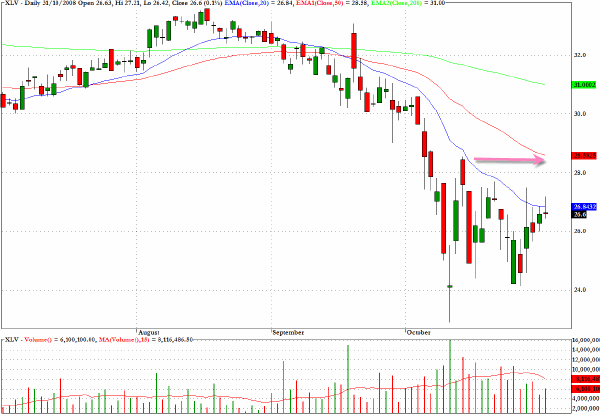
Once again there is a confluence of targets for the ETF for the Health Care Sector, XLV. The October 14 intraday high and the 50-day EMA can be found just above $28.
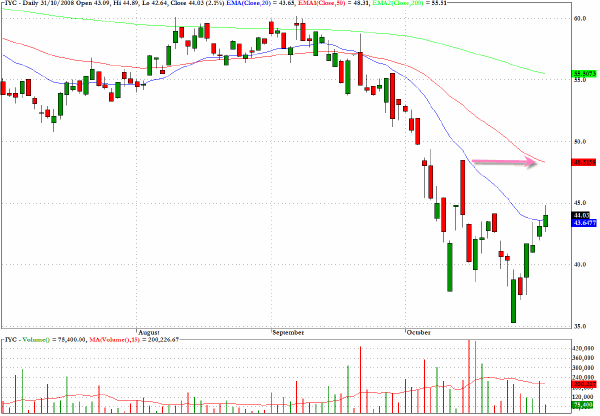
Exactly the same reasoning as for IYR can be applied to the exchange traded fund IYC, which tracks the Dow Jones US Consumer Services sector. This time the target for both the short-term bulls and longer-term bears is in the vicinity of $48.
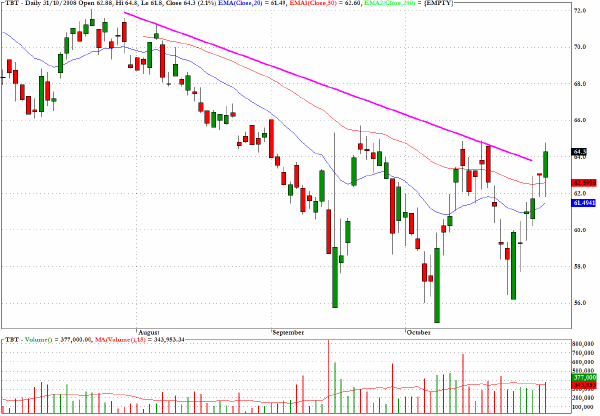
TBT, the Ultra Short Lehman 20 Plus ProShares fund is one of my preferred instruments at present for monitoring the underlying market dynamics. In Friday's column I suggested that this should be seen in terms of a longer-term positioning perspective and I would expect that the behavior of this fund after this coming Friday's data will provide very useful clues as to the market's appetite for long term Treasuries.
Clive Corcoran is the publisher of TradeWithForm.com, which provides daily analysis and commentary on the US stock market. He specializes in market neutral investing and and is currently working on a book about the benefits of trading with long/short strategies, which is scheduled for publication later this year.
Disclaimer
The purpose of this article is to offer you the chance to review the trading methodology, risk reduction strategies and portfolio construction techniques described at tradewithform.com. There is no guarantee that the trading strategies advocated will be profitable. Moreover, there is a risk that following these strategies will lead to loss of capital. Past results are no guarantee of future results. Trading stocks and CFD's can yield large rewards, but also has large potential risks. Trading with leverage can be especially risky. You should be fully aware of the risks of trading in the capital markets. You are strongly advised not to trade with capital.
|