| A Mid-Week Look At The Major Indices |
| By Price Headley |
Published
11/5/2008
|
Stocks
|
Unrated
|
|
|
|
A Mid-Week Look At The Major Indices
S&P 500 Index
On the Daily Chart, the S&P 500 Index broke above its recent downtrendline, but looks to be failing after testing the key 1000 level. Today, the Index gave back the gains it had made over the past 4 trading days. The recent wide range of 850 to 1000 looks intact, and I expect some more downside over the coming days, although it may not be a drastic drop.
S&P 500 Index Daily Chart

NASDAQ 100 Index
If you look at the Weekly NASDAQ 100 Index Chart over the past two years below, you can see the breakdown below the Bottom Acceleration Band, combined with very low Percent R and Efficiency Ratio readings. This week, we have tested the Bottom Band, yet appear to be failing there.
NASDAQ 100 Index Weekly Chart

Dow Jones Industrial Average
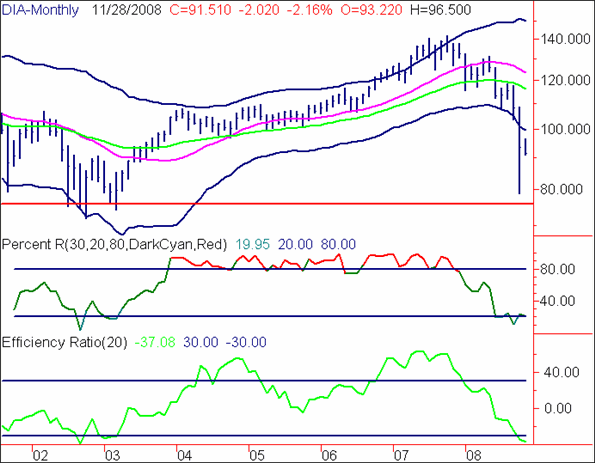
The longer-term DIA chart since 2002 shows the recent break below the Bottom Acceleration Band on a Monthly basis, combined with poor Percent R and Efficiency Ratio readings. I would anticipate that 100 (10,000 on the DJIA) would be likely resistance on any rallies, while downside potential exists to go back to the 2002/2003 lows around 75 (7,500).
Dow Jones Industrial Average (DIA) Monthly Chart

The bottom line at mid-week this week is that further short-term downside appears likely, as we are having a bit of a "sell the news" reaction to the election results. The longer-term Weekly and Monthly charts show the extent of the recent downside damage, and it will likely take some time to repair that - the market may have to enter a sideways basing period before a real rally can ensue.
Price Headley is the founder and chief analyst of BigTrends.com.
|