| Outlook On The Stock Indices |
| By Price Headley |
Published
11/9/2008
|
Stocks
|
Unrated
|
|
|
|
Outlook On The Stock Indices
NASDAQ Composite
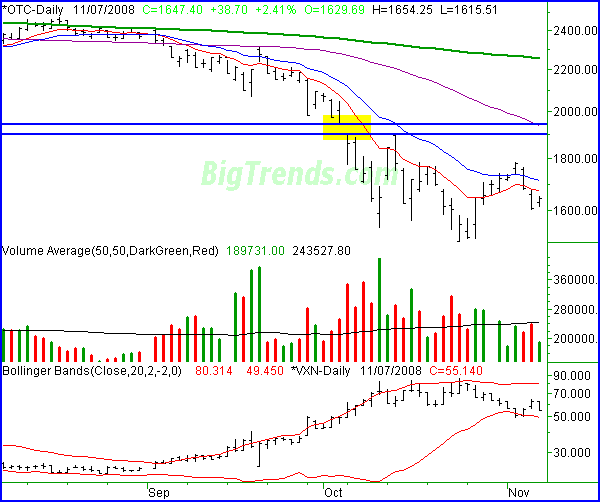
The NASDAQ gained 2.41% (+38.7 points) on Friday, ending the session at 1647.4. That was 73.55 points below (-4.27%) the prior week's closing level. However, the string finish to the week and the inside bar on Friday suggest there's a better chance of more upside than downside.
We're putting most of the focus on the S&P 500 this week, but a couple of short thoughts on the NASDAQ's chart. Though Wednesday and Thursday were nasty, notice how volume wasn't all that high. In other words, it's not like there were a lot of sellers. Odds are some big gain earlier in the week just inspired as little profit taking. Nobody chose to stand in their way. On the other hand, Friday's volume was a little anemic, but that may have been more a symptom of Friday than a symptom of no buyers. We'd certainly like to a strong volume gain to put the uptrend back into motion, but we're certainly not bearish based strictly on Wednesday and Thursday.
Second, it looks as if the VXN is in a downtrend again. The real test for the VXN will come at the lower Bollinger band (30 day , 2 SD's) at 49.50. The lower band was part of the reason for a wicked reversal on Tuesday/Wednesday, so it'll be interesting to see what happens the second time the VXN runs into it.
In the meantime, as long as 1600 holds up, we remain optimistic. A move above 1715 would be pretty bullish, though we still don't trust any rally past 1947.
NASDAQ Composite Chart - Daily

S&P 500
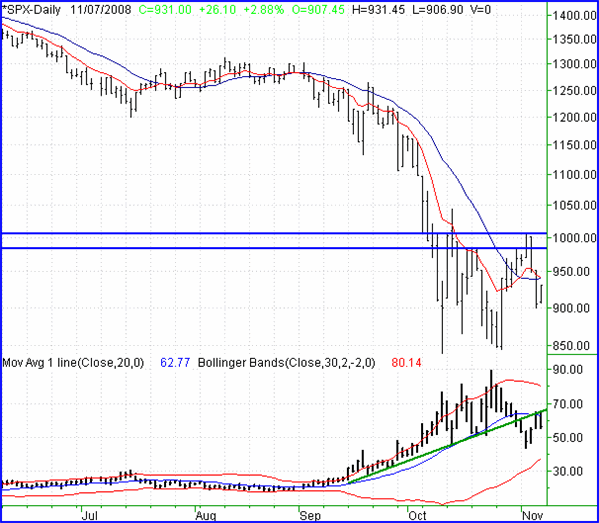
On Friday, the S&P 500 rallied 2.88% (+26.10 points) to close out at 931.00. On a weekly basis, that was still a loss of 3.90% (-37.75 points).
The trend? It's a coin toss at this point. A week ago we pointed out how the first close above the 10- and 20-day moving average lines was bullish, but this week we closed back under both of those lines. And the bullish cross of those lines? Yeah, it was undone too - the 10-day line is back under the 20-day average.
The message in all this is (unfortunately) that this is still a reversal-based market rather than a momentum-base market. We can make a move, I either direction, for two to four days, and then that's it - out of steam. So, the reversal clues still mean a little more than any momentum clues.
The VIX looked like it was falling a week ago, but a strong more higher Wednesday and Thursday suggested any major bullishness could be premature. If you look closely though, you'll see the VIX also hit resistance at its 20-day moving average line on Thursday, and was pointed lower on Friday. Since the 20-day line has been such an important line for the last two months (as support, or as a signal line), we're not going to overlook that turn-around.
At the same time, though it was quiet, we say an inside bar reversal effort on Friday from the S&P 500. By 'inside', we just mean the high and the low for Friday were in between the open and the close from Thursday, and pointed in the opposite direction (bullish instead of bearish). This is a slight hint that the bears are done and the bulls are trickling back in. Follow-through on Monday is the key.
Most importantly though, we're still waiting for a move above 1000/1010 to really get bullish. That's been the ceiling for three weeks now. We're going to say short-term support is at 900.
S&P 500 Chart - Daily

Dow Jones Industrial Average
The Dow's 2.85% rally on Friday (+248.0 points) led it to a close of 8943.81. For the week, that meant a loss of 381.2 points (-4.09%), most of which was seen on Wednesday and Thursday. Though the week was a loser, the intermediate-term trend actually turned bullish.
The Dow is the only market index still showing us a positive (bullish) divergence between the 10- and 20-day moving averages. Then again, it was the slowest to give us a bullish cross of those two lines. Either way, there's a lot of upside potential for these blue chips. It was the only index pressuring its 10- and 20-day averages on Friday. A move above them -- to 9050 or higher -- would be a bullish signal. That signal may be enough to get the index all the way up to 10,500 or so.
On the flipside, we're drawing a support line at 8600.
Dow Jones Industrial Average Chart - Daily

Price Headley is the founder and chief analyst of BigTrends.com.
|