| Corcoran Technical Trading Patterns For November 10 |
| By Clive Corcoran |
Published
11/10/2008
|
Stocks
|
Unrated
|
|
|
|
Corcoran Technical Trading Patterns For November 10
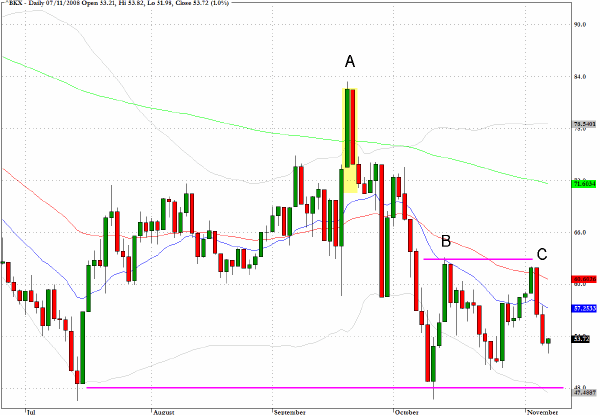
The chart below for the KBW Banking Index (^BKX) was one that I featured in last Friday's slot on CNBC's European Closing Bell, and it is one index that I'll be watching closely this week. I have marked the three failure patterns at A, B and C and, as is apparent, this index seems to be struggling at a critical stage in a downward wedge pattern, despite the much trumpeted double bottom pattern that has prompted some money managers to jump into the banks.
While the pricing of the TARP program's purchase of all the toxic stuff remains unclear, and the extent of the damage to the bank's balance sheets is still largely unquantifiable, buying into this sector is even more of an act of blind faith than buying most other sectors where the near-term earnings are not much better than guesswork.
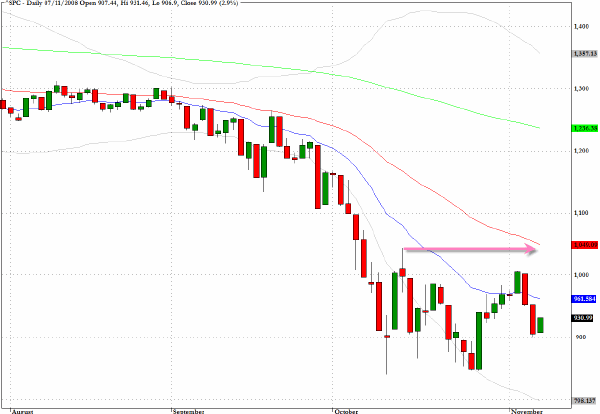
News that China is embarking on major reflationary measures and also that the UK government is planning tax cuts to jump start the troubled UK economy could give a fillip to equities in the near term. The 1050 level on the S&P marks the intraday high from October 14 and also the 50-day EMA.
Reaching up to this barrier, however, could well be a signal for many funds that have registered large redemption requests to escalate their liquidation activities.
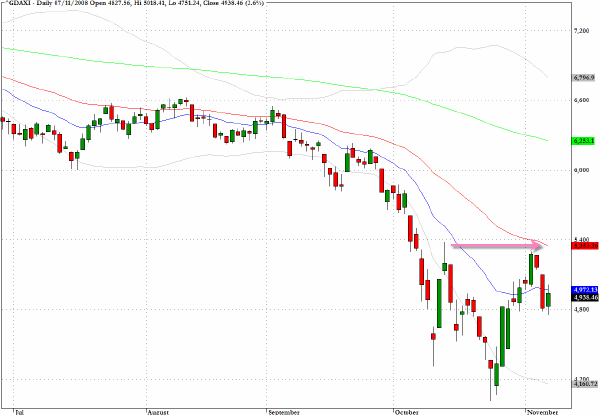
After the interruption in the "V" shaped recovery, the DAX index seems to have found renewed momentum and now could be headed to a test of the 5350 area.
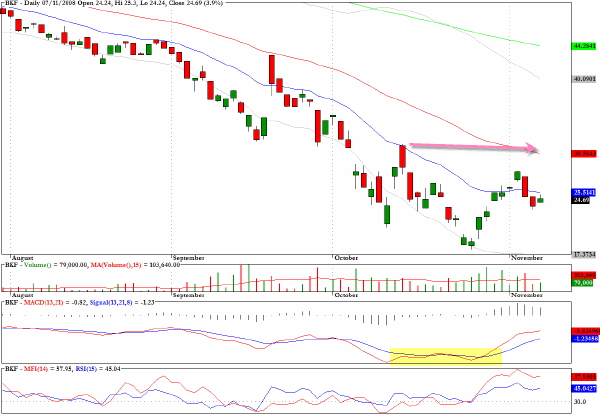
The MSCI BRIC index as tracked by the exchange traded fund BKF was another chart that I focused on in the CNBC slot last Friday, and I pointed out that the chart is evidencing some positive divergences. The news from China over the weekend should be constructive for this sector.
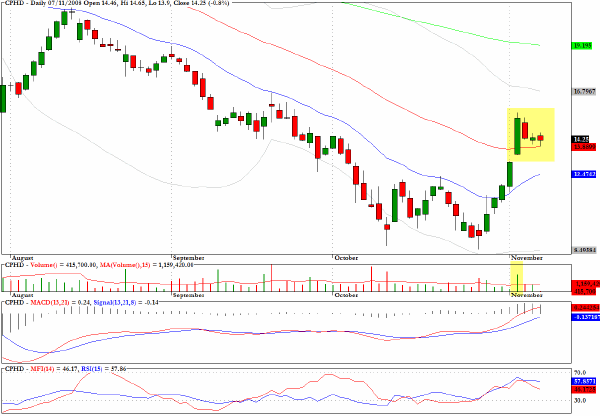
Cepheid (CPHD) has registered a buy signal from my pattern recognition scans.
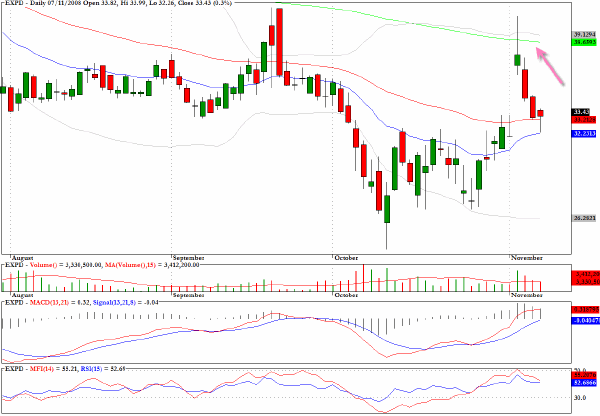
I would be targeting another test of the 200-day EMA for Expeditors International (EXPD).
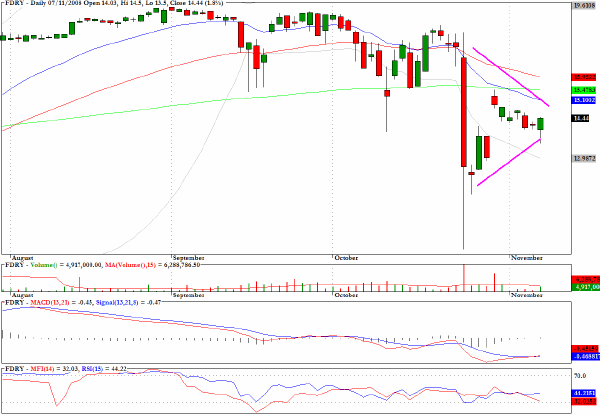
Foundry Networks (FDRY) looks vulnerable to a breakdown from the triangular pattern.
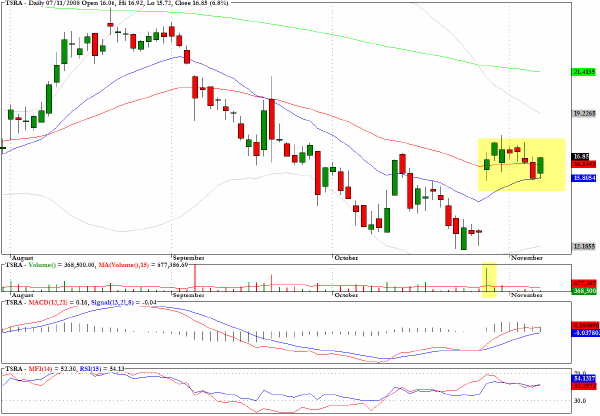
Tessera Technologies (TSRA) also triggered a buy signal from scanning as it matches most of the requirements of an evolving bullish flag pattern.
Clive Corcoran is the publisher of TradeWithForm.com, which provides daily analysis and commentary on the US stock market. He specializes in market neutral investing and and is currently working on a book about the benefits of trading with long/short strategies, which is scheduled for publication later this year.
Disclaimer
The purpose of this article is to offer you the chance to review the trading methodology, risk reduction strategies and portfolio construction techniques described at tradewithform.com. There is no guarantee that the trading strategies advocated will be profitable. Moreover, there is a risk that following these strategies will lead to loss of capital. Past results are no guarantee of future results. Trading stocks and CFD's can yield large rewards, but also has large potential risks. Trading with leverage can be especially risky. You should be fully aware of the risks of trading in the capital markets. You are strongly advised not to trade with capital.
|