| Corcoran Technical Trading Patterns For November 12 |
| By Clive Corcoran |
Published
11/12/2008
|
Stocks
|
Unrated
|
|
|
|
Corcoran Technical Trading Patterns For November 12
Yesterday's trading was another roller coaster ride for US equities and the lows reached in mid-session threatened to trigger a cascade for a new leg down. Volume was slightly heavier than that seen in Monday's session despite the fact that the fixed income markets were essentially inactive due to the Remembrance Day holiday.
The very near term outlook is, as usual, difficult to discern but this could be a good opportunity to address questions that I am being asked by several readers which are as follows:
Do you think we go to new lows in equities before the end of the year or do we wait until Q1, 09?
Or are the lows already in?
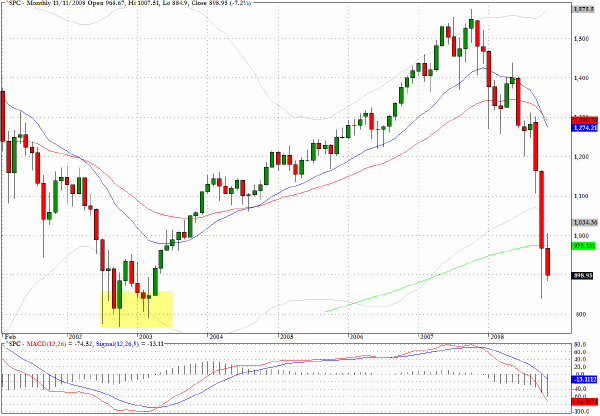
I shall sidestep the first question today and revisit this in another column, but as I have said, the longer term monthly charts for the S&P 500 (^SPX) suggest strongly that the 2002/3 lows need to be re-examined. So my answer to the second question is no.
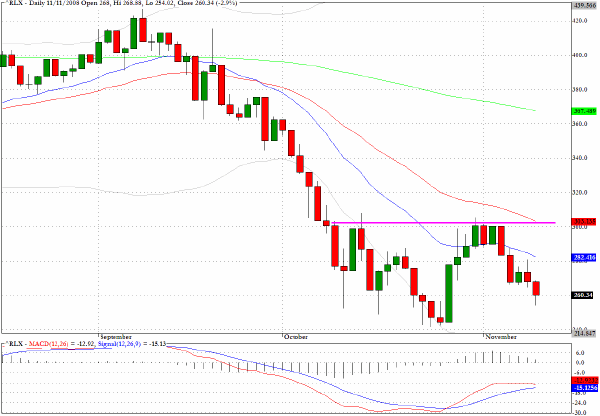
Although there is more than the unusual uncertainty about near-term direction, there are several charts where clear evidence exists of formidable overhead resistance. The chart below shows that the 300 level has proven to be a major hurdle for the S&P Retail index, and the path of least resistance seems to be further down.
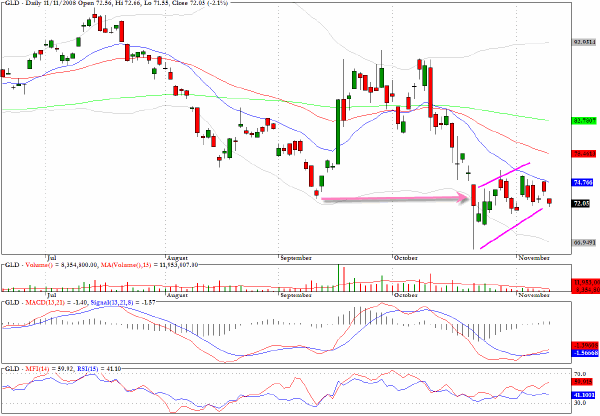
The technical picture for gold, as reflected in the exchange traded fund GLD, is quite intriguing. On the surface the bearish flag pattern suggests lower prices ahead but the positive divergences on the MACD and MFI chart caution me from looking at the short side. At present I would suggest staying on the sidelines, but if there was a decisive break above the 20-day EMA around $75 the long side would be my preference.
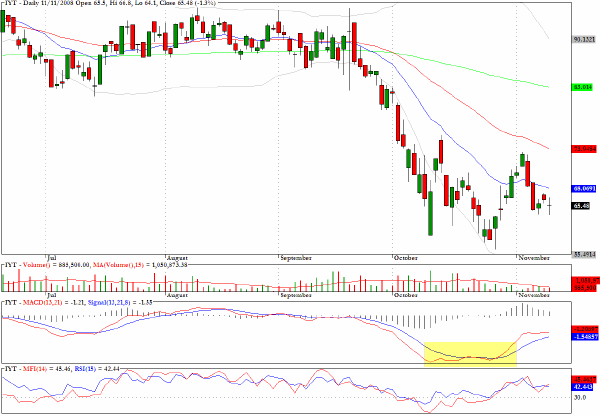
The sector fund which tracks the Dow Jones Transportation index, IYT, is somewhat counter-intuitively revealing some positive divergences.
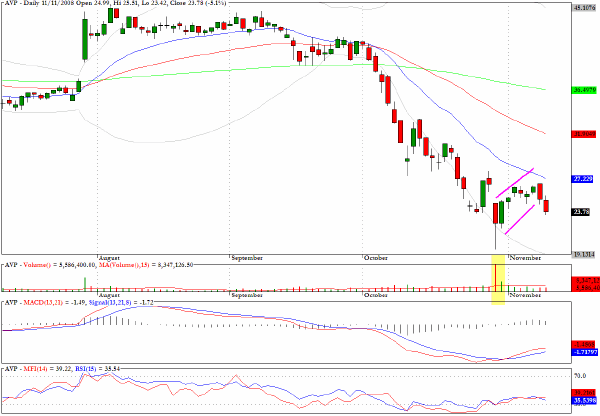
Avon Products (AVP) looks set to continue further downwards after its breakdown from a bearish pullback channel.
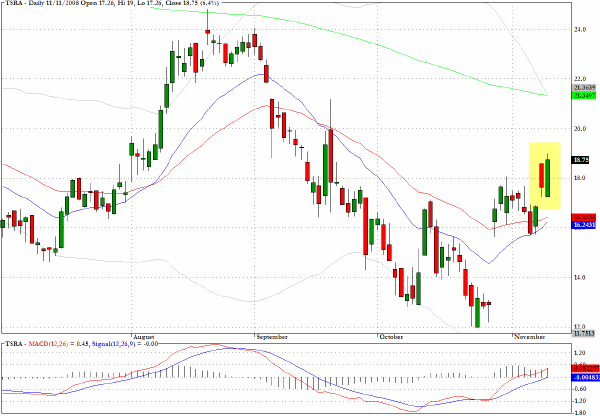
My suggestion yesterday the Tessera Technologies (TSRA) looked promising for further upward progress after the gap up in Monday's session proved to be profitable with a seven percent available during the session if a long position had been taken on the open.
Clive Corcoran is the publisher of TradeWithForm.com, which provides daily analysis and commentary on the US stock market. He specializes in market neutral investing and and is currently working on a book about the benefits of trading with long/short strategies, which is scheduled for publication later this year.
Disclaimer
The purpose of this article is to offer you the chance to review the trading methodology, risk reduction strategies and portfolio construction techniques described at tradewithform.com. There is no guarantee that the trading strategies advocated will be profitable. Moreover, there is a risk that following these strategies will lead to loss of capital. Past results are no guarantee of future results. Trading stocks and CFD's can yield large rewards, but also has large potential risks. Trading with leverage can be especially risky. You should be fully aware of the risks of trading in the capital markets. You are strongly advised not to trade with capital.
|