| Corcoran Technical Trading Patterns For November 13 |
| By Clive Corcoran |
Published
11/13/2008
|
Stocks
|
Unrated
|
|
|
|
Corcoran Technical Trading Patterns For November 13
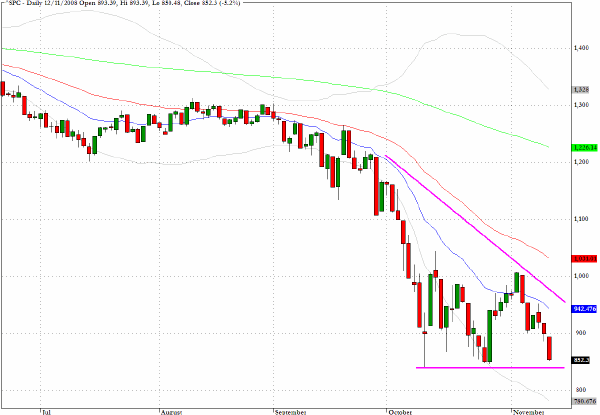
The S&P 500 is hanging on by its fingertips - today could be critical.
If we break aggressively below the previous low from October 10, we should be headed towards the 2002/3 lows again.
Especially worrying are the charts for Citigroup (C), Bank of America (BAC) and Goldman Sachs (GS), all of which are covered below.
Today's big mystery for me is why did Paulson change his mind about buying all that toxic stuff? Perhaps it was even more toxic than he initially thought it was.
What we are seeing on most charts is the classic downward wedge pattern which characterizes failed rallies in a bear market. We have retreated on the S&P 500 to the baseline of the triangular pattern. If we drop below this today and take out the intraday low from October 10, my guess is that we could be at 800 in a hurry.
Even if we manage a rally here, and as in all bear markets it could be abrupt and very shocking for those short the index futures, the longer-term pattern looks so grim that it is hard to avoid the conclusion that fund managers are waiting for much lower prices before they get a real glimpse of the other side of the valley.
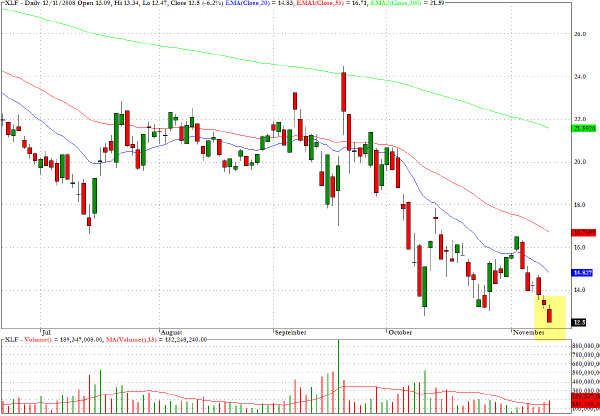
The exchange traded fund for the financial services XLF shows that in yesterday's action we have broken down below the critical baseline of the triangular pattern alluded to above and taken out the October 10 low.
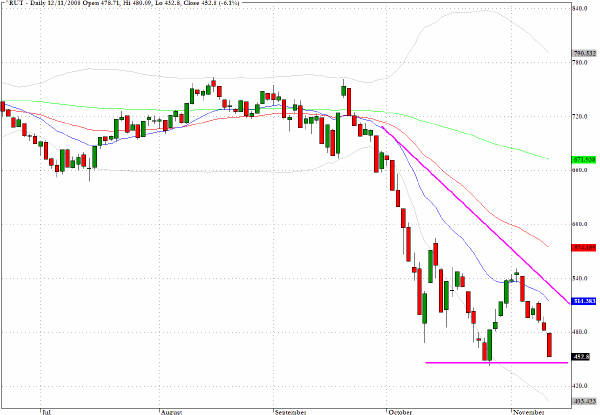
The Russell 2000 (^RUT) out-performed on the downside yesterday with a more than six percent loss and has all but returned to the October intraday low.
Stepping back to the larger picture on the chart, the steepness of the drop since mid-September reveals the extent to which massive liquidations of stock by long only fund managers has been taking place over the last six weeks.
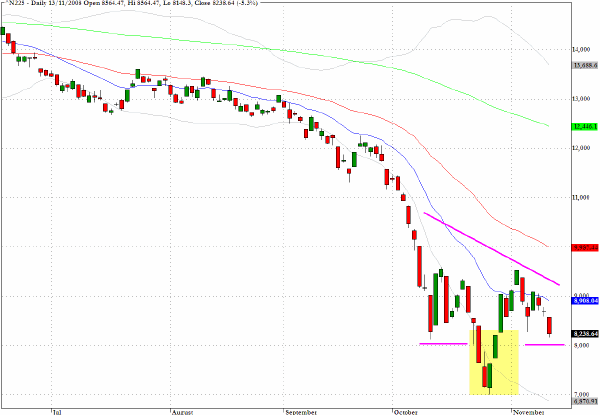
In Thursday's session the Nikkei 225 fell back another five percent and is testing the pre-panic low from October 10. The actual panic low is the one which I have highlighted in yellow.
Some analysts felt that the panic drop down to levels seen 26 years ago could have represented a capitulation event for this market. Unfortunately the recent action seems to refute that diagnosis and the Japanese market panic selling in the latter half of October could, in hindsight, have been the warning signal that further panic selling is probable not only in Japan but also in other global equity markets.
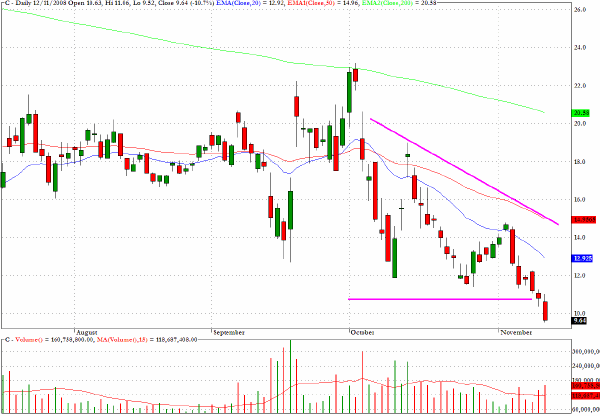
Citigroup (C) has broken decisively below the wedge baseline and closed in single digits. The chart below is very disconcerting for the whole market, in my opinion.
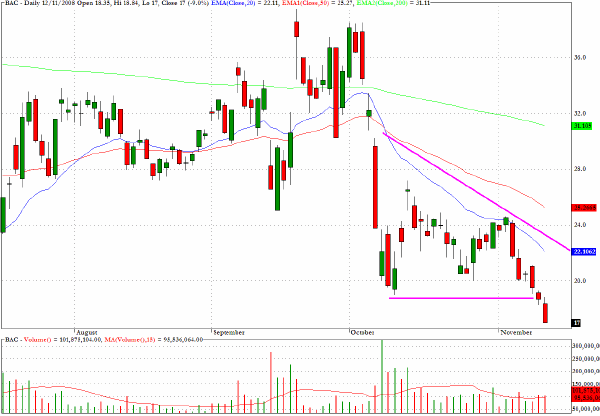
Bank of America (BAC) is also now convincingly registering new multi-year lows. When I mentioned above that the overall market is hanging on by its fingertips and could be on the verge of cascading downwards, it is to stocks like BAC that I shall be looking in the days ahead for clues as to how deep the chasm ahead might be.
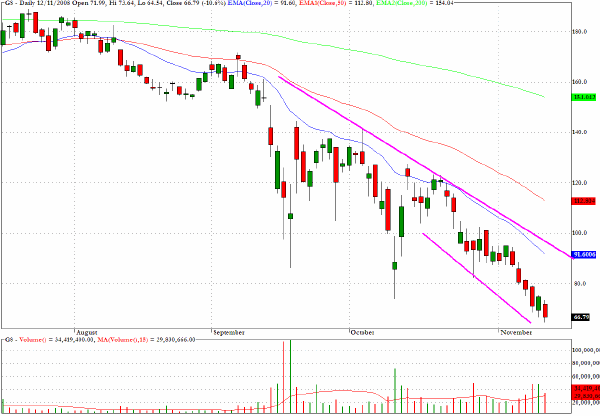
The chart for Goldman Sachs (GS) shows a clear sell channel - not even a wedge pattern which suggests that traders have given up on this stock and have not even been attempting to rally it.
This chart is telling us that the entire business model for this company is broken and it raises the question of what Warren Buffet was thinking when he decided to buy into this company at almost twice the level that the stock closed yesterday.
Could this be the shakeout when even the "smart money" no longer looks so smart any more?
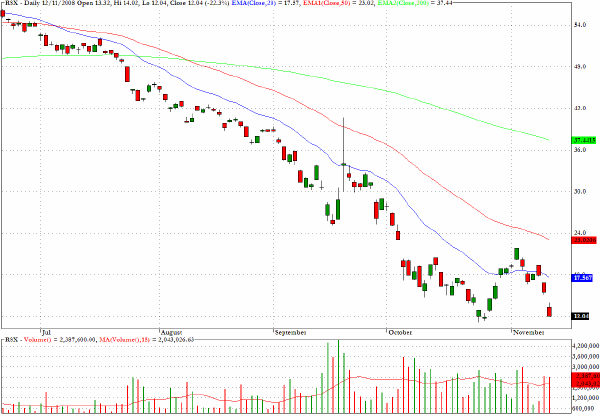
The sector fund for Russian equities (RSX) is one of the most dramatically bearish that I can recall.
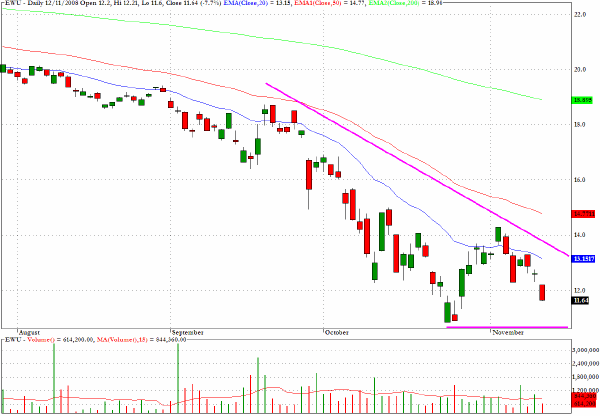
EWU, which tracks the performance of the MSCI UK index, provides a better perspective on the domestic economy in the UK itself rather than the FTSE which is more exposed to international and resource stocks. The chart below shows that this market also has a rendezvous with the baseline of the wedge pattern discussed above.
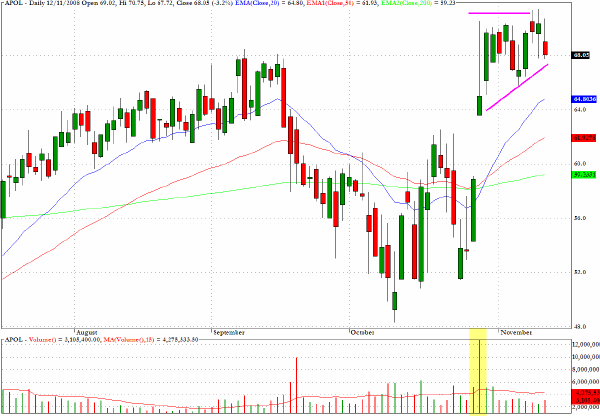
I believe this to be a very high risk environment and apart from my "black box" systematic strategies which are still generating signals, I am primarily on the sidelines in discretionary trading activities. One signal generated from my system-based pattern recognition which has a more than 60% win/loss ratio is a long signal on Apollo Group (APOL). As a word of caution, and in line with the customary risk disclosure, this ratio suggests that 40% of the time this trade will be a loser.
Clive Corcoran is the publisher of TradeWithForm.com, which provides daily analysis and commentary on the US stock market. He specializes in market neutral investing and and is currently working on a book about the benefits of trading with long/short strategies, which is scheduled for publication later this year.
Disclaimer
The purpose of this article is to offer you the chance to review the trading methodology, risk reduction strategies and portfolio construction techniques described at tradewithform.com. There is no guarantee that the trading strategies advocated will be profitable. Moreover, there is a risk that following these strategies will lead to loss of capital. Past results are no guarantee of future results. Trading stocks and CFD's can yield large rewards, but also has large potential risks. Trading with leverage can be especially risky. You should be fully aware of the risks of trading in the capital markets. You are strongly advised not to trade with capital.
|