NASDAQ COMMENTARY
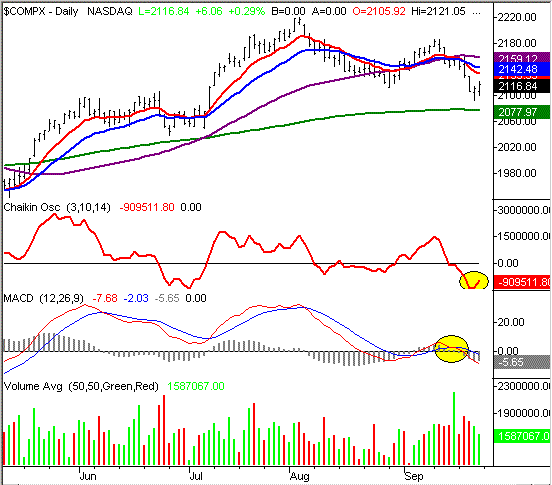
The NASDAQ ended the week at 2116.84. That's 43.5 points (-2.0 percent) below where it closed the Friday before, but it's still well above the week's low of 2093.06. That's the bottom that was hit on Thursday, just a few hours before stocks bounced back to make a head-turning bullish move. That 24 point improvement has our attention, but there's a long way to go before the bulls should get comfortable again.
The bottom line is simple - what happens at the 10 and 20 day moving averages will guide our next move. They're currently at 2134 and 2142, just 16 points and 24 points away from where we ended on Friday. So, it shouldn't take too long to get one of two outcomes. Either will hit resistance there and pull back again, or we'll not find resistance there.....and keep moving higher. We've seen these two averages both fail and hold as resistance this year, so it's almost a coin toss from here. We're inclined to think that these lines will not hold as resistance, instead allowing the index to move closer to the 2180 area. Why? The composite has been in chopsterville all year long. We've seen a total of 15 crosses of the 10 day moving average this year, and the index is basically flat since January. Why would the mode change now? We think we'll see the NASDAQ move a little above the short-term averages, but it's doubtful it could muster a move past 2220, at best.
The less likely scenario is resistance at the 10 and 20 day averages, but if we do get it, look for the index to ultimately retest the 200 day line at 2078. That would only be a minor correction though. In the meantime, be patient and don't try and outguess the market.
NASDAQ CHART - DAILY

S&P 500 COMMENTARY
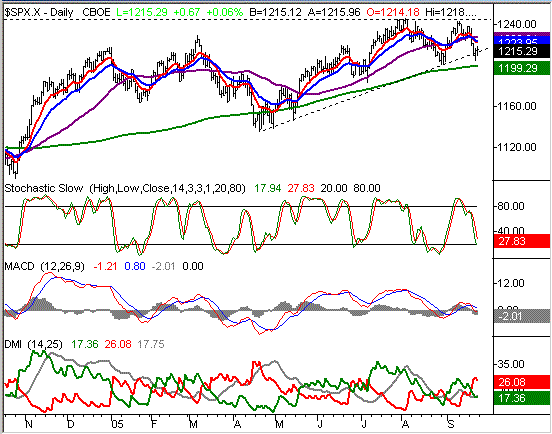
The S&P 500 lost 22.58 points last week, or 1.8 percent. The close of 1215.29 wasn't all that bad though, considering we had seen the index reach as low as 1205.65 the day before. But like the NASDAQ, there's a whole lot more work to be done here before these charts become bullish again.(
The large number of mixed signals right now will let us keep this brief. The S&P fell under long-term support (dashed) in the middle of the week, but closed back above that line by the end of the week. But support was still breached, and the SPX is still under all of the short-term and intermediate-term moving averages. So, we have to give some credit to the bears.
The bulls have a little to look forward to as well. Thursday's rebound and Friday's follow-through has an obvious bullish quality. Plus, we're still above the 200 day line, and we did manage to get back above support. A lot of that buying pressure was the result of a sharp selloff that left stocks very oversold. Although the stochastic lines are not yet in 'oversold' territory, they will be soon. The thing is, as soon as they get there, they're going to get pulled immediately higher again (because of the strong end to the week).
So like the NASDAQ, we're trapped between a rock and a hard place. The 10 and 20 day lines are at 2134 and 2142 (respectively), so we won't need to wait too long before the next significant move begins. Let's wait and see what happens there before making any stand. A break past those lines means the index could run up to the high of 2186. A failure to cross those lines could lead to a pullback all the way to the 200 day line at 2078.
S&P 500 CHART

DOW JONES INDUSTRIAL AVERAGE COMMENTARY
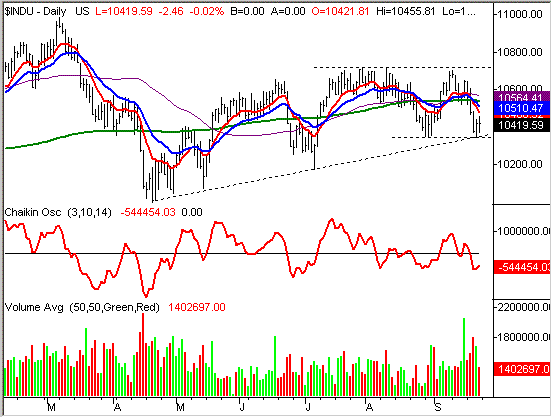
The Dow Jones Industrial Average gave up 222.35 points last week, falling from 10,641.94 to 10,419.59. Back in their old form again, these big blue-chips were the least impressive (or most troubled) stocks - they lost an average of 2.1 percent, which was the biggest loss of the three major indexes we watch. At this point, we have to wonder if it's an epidemic that could plague the Dow for a while.
Whatever we said above also applies here, so we're not going to repeat it. We'll just go over the specific levels to watch. Support is at 10,350. That's the low from last week as well as August, but that's also where the intermediate-term support line is resting right now. So, that's a pretty solid floor. Should it fail, the next potential support levels are at 10,175 and 10,000. Resistance is everywhere between 10,493 and 10,568. Past that, we've seen resistance more than once around 10,700. Until we break out of that narrow zone, there's really not much opportunity to worry about. But in the short run, we're still looking for the index to be able to move back above the key moving averages.....by a little.
DOW JONES INDUSTRIAL AVERAGE CHART

Price Headley is the founder and chief analyst of BigTrends.com.