| Outlook On The Stock Indices |
| By Price Headley |
Published
11/15/2008
|
Stocks
|
Unrated
|
|
|
|
Outlook On The Stock Indices
NASDAQ Composite
The NASDAQ lost another 5.0% on Friday (-79.85 points) to end the day at 1516.85. For the week, the composite was lower by 130.55 points, or -7.92%, the worst of the worst among the indices, even the Russell.
The chart is pointed lower. Friday wasn't the lowest close in years; it was just the third lowest. But, we're headed towards falling under a moderately-important support level (1499-ish), with nary a bull in sight.
OK, it's not like there are no buyers at all. There are just no buyers willing to stick around for more than a day. The bears, however, seem to be comfortable enough to keep coming back for more and who can blame them?
Technically speaking, the NASDAQ appears to be guided lower by its 10-day moving average, so as long as it's under it, we're expecting more downside. On the flipside, that lower Bollinger band (20-day) appeared to be a bounce point in the middle of the week. That's a narrow zone (though a bearish one) for the composite to bounce around in, so it's a little pointless to start making forecasts right now. Let's see if one of those lines breaks first.
That said, if the lower band line breaks along with support around 1500, and the NASDAQ closes under it, there's not a lot that could prevent yet another round of selling. No target price yet. We'll burn that bridge if and when we come to it.
NASDAQ Composite Chart - Daily

S&P 500
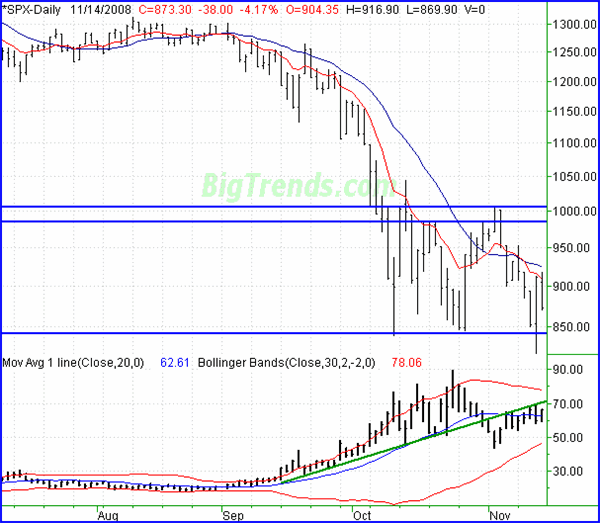
The S&P 500's 4.17% dip (-38.0 points) on Friday led it to a close of 873.30. On a weekly basis, that meant a 57.7 point (-6.20%) hit for the large cap index. Though the volatility worked in both directions this past week, it worked more often against the market than for it. The week ended on a bearish note, so we have to assume we'll start next week the same way, though making any guess over the last two months has been pointless.
The story, though, is the trading range. The same trading range we've been talking about for the same two months. The upper edge is around 1000, while the lower edge is close to 845.
Don't think for a minute we didn't see the SPX hit a low of 818 on Thursday. We saw it. We also say it rebound and make a ridiculous move higher. Perhaps you saw the same lack of follow-through we saw on Friday? What a circus. The market was clever enough just to stop out anybody who was going to sell at 845 or lower, but that ended up just being a setup. The buyers stepped in a couple of hours later.
So, here's our view. We're assuming we're still range bound, but only a close under 845 will mean anything. Even then, it won't mean much. We really need to see a couple of lower closes to suspect stocks are headed for more trouble.
In the meantime, the VIX is on the rise, with plenty of room to run. The upper Bollinger band is at 78, while the VIX itself is at 66.31. Based on the VIX's momentum we have to take a bearish view. However, by this point. we all know this is more of a coin toss than an endeavor of logic.
S&P 500 Chart - Daily

Dow Jones Industrial Average
On Friday, the Dow sank by 337.94 points (-3.82%) to end at 8497.31. That was 446.50 points below (-4.99%) the previous Friday's closing level.
Short and sweet here for the Dow, since the message is about the same anyway...support lines are being tested much more often than resistance lines are, though the trading range is still intact.
There's one inescapable fact though: volume. Between the frequency of bearish days, the persistence of volume behind those selloffs, the lack of bullish days, and the lack of any serious volume behind those few gainful days.
The accumulation-distribution line and the Chaikin line are both now pointed lower, telling us the volume trend is bearish. There's no arguing it.
The question of course is whether or not the volume trend means anything. The market is being pushed around by fear and greed more than anything else right now, which tends to ebb and flow daily. So, volume is only a supporting cast member at this point.
Dow Jones Industrial Average Chart - Daily

Price Headley is the founder and chief analyst of BigTrends.com.
|