| Corcoran Technical Trading Patterns For November 17 |
| By Clive Corcoran |
Published
11/17/2008
|
Stocks
|
Unrated
|
|
|
|
Corcoran Technical Trading Patterns For November 17
Friday's action saw a reversal of a large part of Thursday's rather technical rally.
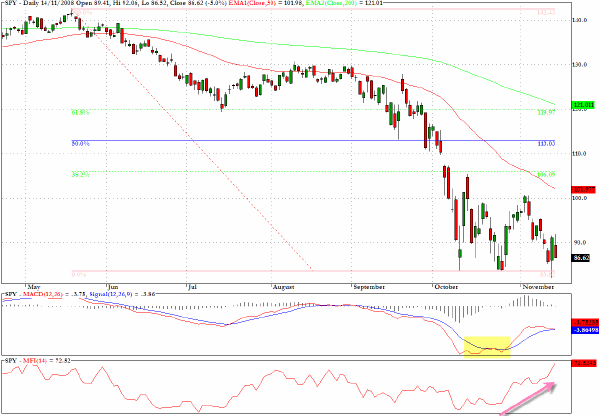
I have focused on the chart for the exchange traded SPY as it allows a better opportunity to evaluate the momentum and money flow characteristics of this key equity index as it can be based upon the volumes being traded on this proxy.
It would seem, especially considering the acute upward slant lately in the money flow index, that this should have been more favorable for the bullish case in the recent past than it has been.
The MACD chart, which is now becoming somewhat more reliable after the month of October when market action rendered this indicator effectively useless, registers the fact that last week's test of the recent was not accompanied by any conviction and downside momentum.
My hunch, and it is nothing more, is that we are witnessing a platform from which the bulls are expecting, and perhaps more importantly, hoping, to build a rally into the end of the year.
Sometimes these charts reveal more psychology than is evident on the surface and this chart speaks to me of still a lot of optimism that a tradable bounce is now due.
It also underlines my concern that, in terms of a washout for this troubled market, there is still too much bullish hopefulness in the market.
I would be very wary of expecting closes much above the 1000 level on the S&P 500 cash index, and longer term there is still a strong case to be made that we will see a further leg down.
The US dollar, as well as the Japanese yen, continue to be the currencies that are seeing the most benefits from the huge redemptions resulting from the unwinding of the most speculative and leveraged activities in the global capital markets.
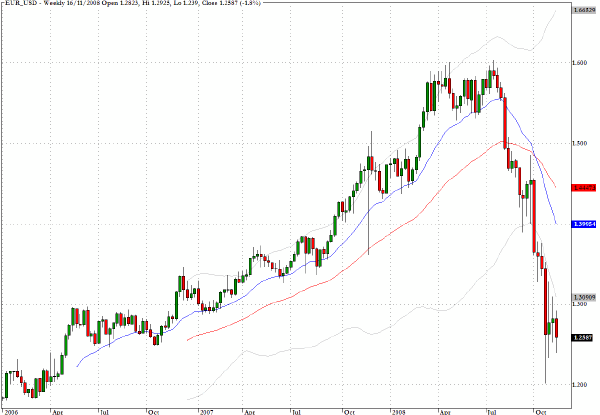
Reviewing the weekly chart for the Euro for the last three years, and the recent spike down to 2006 levels, it is tempting to suspect that the short-term trend for the eurozone currency, especially as the fundamentals continue to weaken, is for a continuation of the downtrend for a robust test of the $1.20 level.
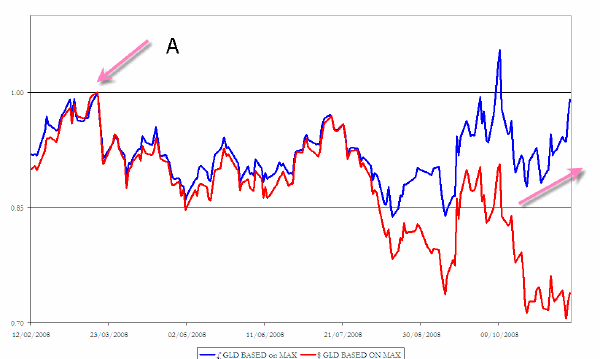
The chart below reveals an index comparing the price of gold in both US dollars and UK sterling. The historic high for the metal achieved on March 17 and market at point A is being used as the base of 100 for the index.
Clearly illustrated is the precipitous slide of the pound since late July as the chart reveals that from the perspective of a sterling investor the price of gold is now more or less at its historic high sterling level again.
On the contrary, the price in terms of the US dollar is now only 75% of what it was in March.
The trend of higher lows in the most recent time frame for gold in sterling suggests that from the point of view of declining purchasing power and the potentiality for imported inflation the UK currency is now in a rather disturbing trend.
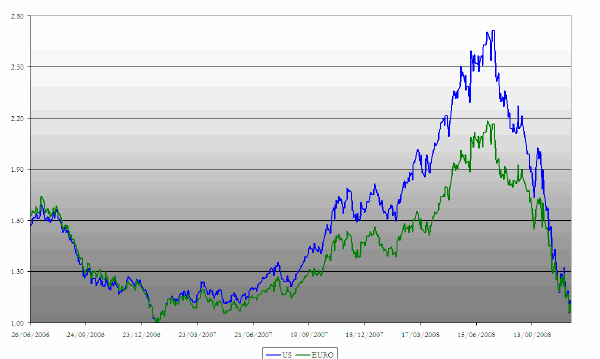
The chart below shows an index illustrating the price of US Crude Oil (as reflected in the sector fund USO) expressed in both US dollars and Euros.
The baseline has been selected at the beginning of 2007 as it captures the lowest point in dollar terms which also coincides with the lowest euro price.
Two things strike me about the chart. The first is that the historic high level in dollar terms reached a fibonnacci uplift level of more or less 2.68 times the base level price.
The second intriguing aspect to this chart is that we have come back down to almost parity with euros in terms of the price of crude as traded in dollars. About another five to ten percent adjustment, and it can come from two sides - changes in the value of the commodity as well as the foreign exchange levels - would lead to a reconvergence of the index. The entire benefit that the Eurozone has enjoyed for two years with its greater purchasing power with respect to key commodities has now been erased.
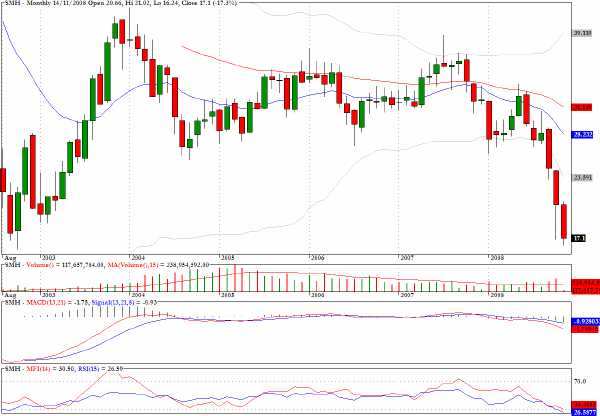
The semiconductor sector has returned exactly to its lows from 2002 and 2003 and on the monthly chart there is little suggestion of any accumulation or possible beneficial consequences arising from any evidence of momentum divergences.
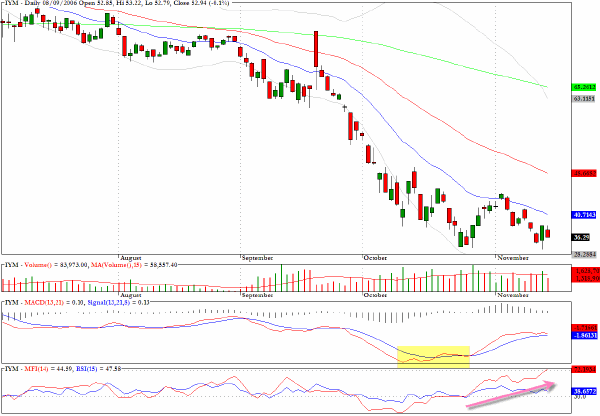
IYM, the exchange traded fund, consists of key stocks in the industrial materials sector. A similar pattern is now present on this sector fund to the one seen on the SPY chart. There are positive MACD divergences and the money flow has been building steadily over the last three weeks but this has, as with the equity sector index, not really produced a sustained upward price move. The technical problem that I see with this chart is that with an MFI reading now above 70 and with the effort more or less spent we may have already seen the bullish contribution such as it was.
Clive Corcoran is the publisher of TradeWithForm.com, which provides daily analysis and commentary on the US stock market. He specializes in market neutral investing and and is currently working on a book about the benefits of trading with long/short strategies, which is scheduled for publication later this year.
Disclaimer
The purpose of this article is to offer you the chance to review the trading methodology, risk reduction strategies and portfolio construction techniques described at tradewithform.com. There is no guarantee that the trading strategies advocated will be profitable. Moreover, there is a risk that following these strategies will lead to loss of capital. Past results are no guarantee of future results. Trading stocks and CFD's can yield large rewards, but also has large potential risks. Trading with leverage can be especially risky. You should be fully aware of the risks of trading in the capital markets. You are strongly advised not to trade with capital.
|