| Corcoran Technical Trading Patterns For November 18 |
| By Clive Corcoran |
Published
11/18/2008
|
Stocks
|
Unrated
|
|
|
|
Corcoran Technical Trading Patterns For November 18
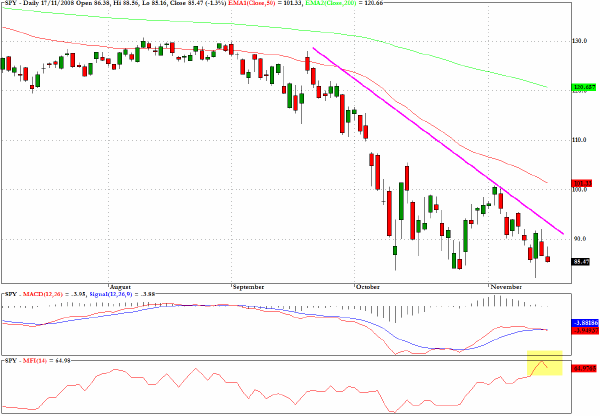
The S&P 500, as expressed in the chart for its proxy fund SPY, is moving ever nearer to the apex of the descending wedge pattern at which point the indecision over a major directional move cannot be prolonged.
The fundamentals are suggesting that we are headed down and the technicals, as I discussed in a CNBC slot yesterday, are somewhat confused by the strong positive divergence on the MFI chart but which has failed to rally the index. The positive volume flow reached above a reading of 70, and yet the price has stubbornly been attracted to the baseline of the wedge pattern.
My main concern is that the bearish interpretation seems just a little too obvious but should the "support" lines of the last month break down there could be an avalanche of selling ahead.
All of which adds up to a fairly hazardous environment for position traders but a very good intraday trading environment.
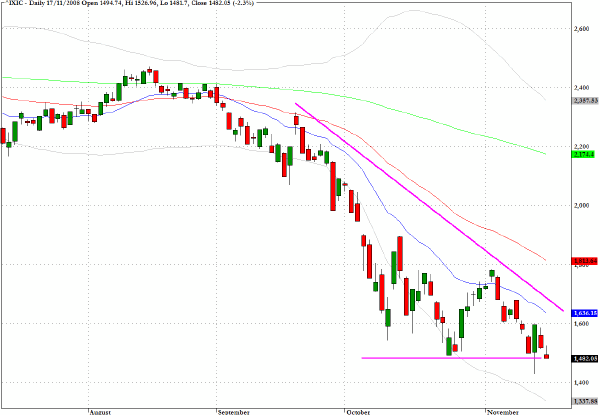
The Nasdaq Composite (^IXIC) is technically the first of the major US indices to register a new multi-year closing low and in so doing puts focus today on the baseline of the wedge formation and the intraday low from last Thursday's session.
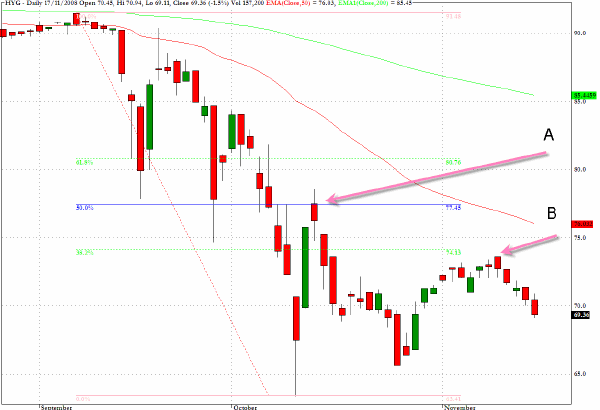
The exchange traded fund that tracks the prices of a cross section of high yielding corporate debt shows that the markets are discounting a lot of distress in this "junk bond" sector. The two retracements have failed at key fibonacci levels - the 50% of the move down to mid-October failed at point A, and the more recent attempt to break above the 38% retracement level failed at point B.
Some analysts are pointing out that the level of defaults now being discounted is far in excess of the view that has been "supporting" equities to date. So we may be about to see which of the two views on the severity of the global downturn is more accurate.
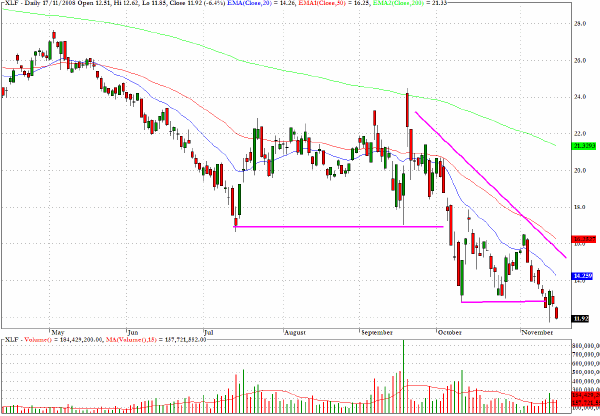
The chart for XLF clearly reveals the way in which all of the efforts by the bulls to call a bottom in this sector are still being met by a grinding realization of any quick gains by short-term traders and a lack of real belief from potential institutional accumulators that the bottom is in place.
This is the third time that I have drawn attention to this chart in the last two weeks and I'll simply repeat my previous comments
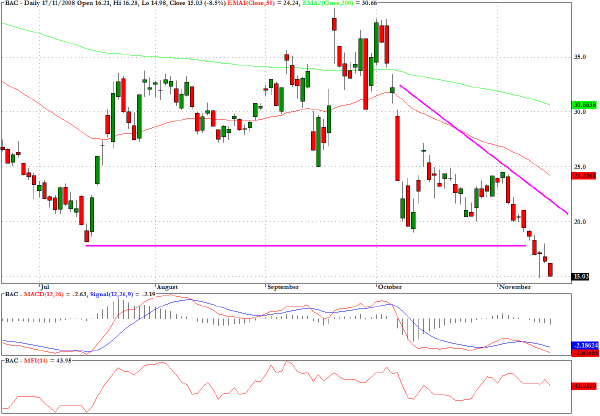
Bank of America (BAC) is also now convincingly registering new multi-year lows...the overall market is hanging on by its fingertips and could be on the verge of cascading downwards, and it is to stocks like BAC that I shall be looking in the days ahead for clues as to how deep the chasm ahead might be.
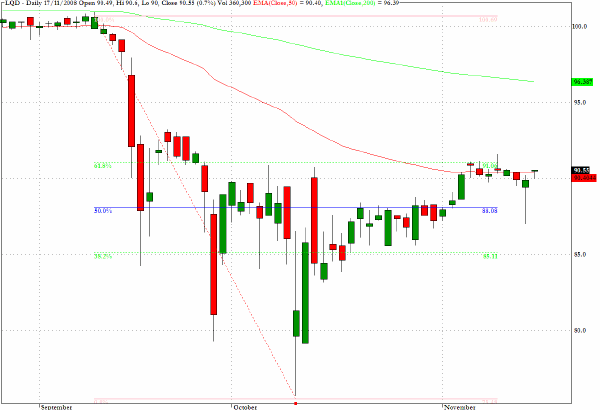
The investment grade corporate bond sector has clearly outperformed the high yield sector but the fund LQD reveals that there is a formidable hurdle to be overcome at the 62% retracement of the downward move in October.
Clive Corcoran is the publisher of TradeWithForm.com, which provides daily analysis and commentary on the US stock market. He specializes in market neutral investing and and is currently working on a book about the benefits of trading with long/short strategies, which is scheduled for publication later this year.
Disclaimer
The purpose of this article is to offer you the chance to review the trading methodology, risk reduction strategies and portfolio construction techniques described at tradewithform.com. There is no guarantee that the trading strategies advocated will be profitable. Moreover, there is a risk that following these strategies will lead to loss of capital. Past results are no guarantee of future results. Trading stocks and CFD's can yield large rewards, but also has large potential risks. Trading with leverage can be especially risky. You should be fully aware of the risks of trading in the capital markets. You are strongly advised not to trade with capital.
|