| Corcoran Technical Trading Patterns For November 19 |
| By Clive Corcoran |
Published
11/19/2008
|
Stocks
|
Unrated
|
|
|
|
Corcoran Technical Trading Patterns For November 19
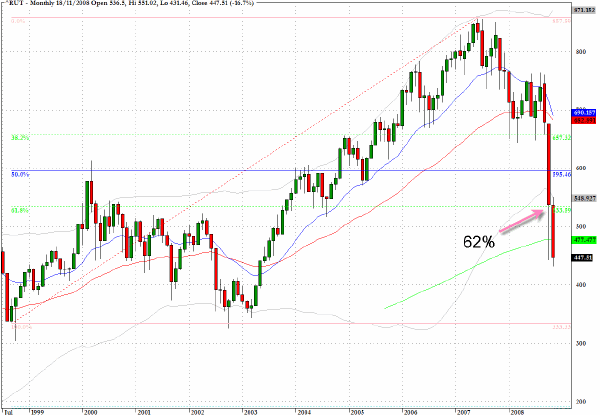
On the daily charts yesterday, most indices managed to confine their intraday lows within the recent ranges. The exception was the Russell 2000 (^RUT) which actually printed a new multi-year intraday low and closed the session as the obvious out-performer on the downside with an 0.8% decline.
The chart I have shown below is a long-term monthly chart going back to 1998 and it shows a couple of revealing technical features. The first is that the steady fall throughout November (already 16%) has now brought this index substantially below the 62% retracement level of the swing high and low covered in the chart. At the conclusion of the very difficult month of October we were more or less exactly at that retracement level.
This clearly suggests that institutions are still unloading the small cap stocks and there is no real evidence that value players are actively seeking out bargains.
Also noteworthy is the fact that this is one of many equity indices that is now below its 200-month moving average.
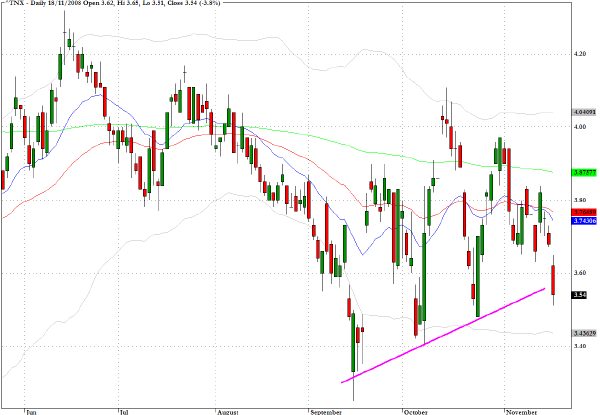
The yields on the ten-year US Treasury have dropped quickly in recent sessions and have now broken the trendline through a succession of recent higher lows. The combination of severe recession fears and continued flight to safety are clearly the principal forces at work here.
I am still of the view that when equity investors claim that they can see the green shoots of recovery in the global economy the long-term US Treasury market will see a rather dramatic rise in yields.
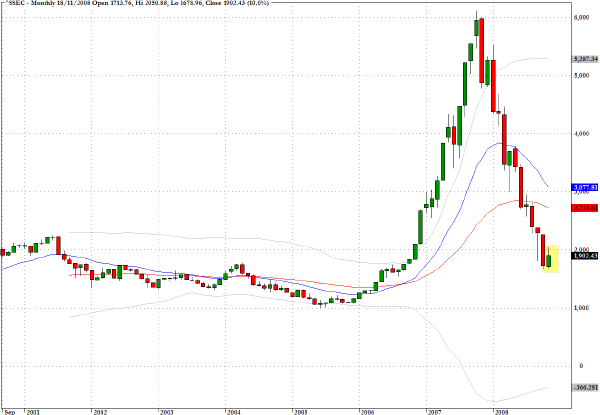
The Shanghai Composite (^SSEC) is one of the few global indices to show a green candlestick for trading during the month of November so far with a ten percent rise. The long-term chart shows just how precipitously this index has fallen over the last year, but there is very little guidance from a purely technical point of view of any real support between the 1000 and 2000 levels on this index.
Needless to say that leaves a lot of room for prices to continue to become even more attractive.
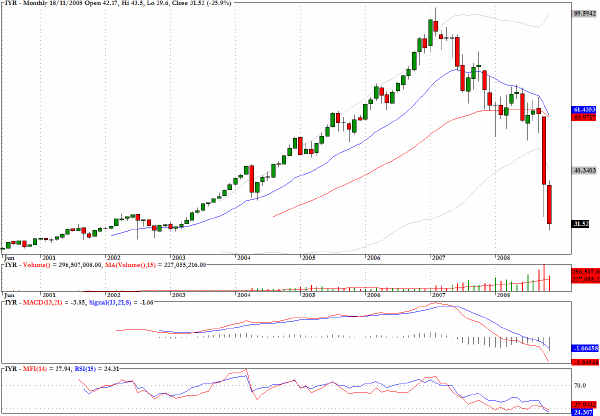
The exchange traded fund which tracks the Dow Jones Real Estate Index is more or less back in the zone it was trading during 2002/3, and still there is no evidence that the attrition will not continue.
Here is a piece which I have recently written for another publication and which offers my view on the likelihood that fiscal stimulus efforts will help to turn the real estate market around.
WILL TAX CUTS AND FISCAL STIMULUS IMPROVE THE REAL ESTATE MARKET?
The recent G20 meeting appears to have embraced the Keynesian notion that in order to stimulate Aggregate Demand there should be a fiscal stimulus of about 2% of global GDP. Without going to deeply into the Keynesian theory, the multiplier effect can then enable this direct stimulus to be translated into more jobs and investment, all of which will enhance aggregate demand in a self-reinforcing manner that should, at least according to the theory, arrest the contraction in global economic activity.
Several major problems exist now for this diagnosis, not the least of which is the nature of the multiplier effect and the ability and willingness of consumers and corporations to actually spend the additional purchasing power that governments are intending to create.
The ability will depend a lot on the indebtedness and solvency of many households, especially in those economies which have non-existent savings rates such as the US and the UK. The marginal propensity to consume for such households may be virtually zero and therefore inhibit the multiplier effect. Even those who may tempted to use extra purchasing power but require it to be supplemented by bank borrowing, or access to credit, will face the fact that the banking sector will, probably for the foreseeable future, be more intent on hoarding the cash being injected by governments to rebuild their balance sheets.
But the biggest problem is that the marginal propensity to consume at the level that really matters, in other words to start purchasing homes again, depends on whether consumers feel that there is another kind of multiplier effect at work. The median price of homes in the US and UK are still essentially not affordable, in terms of their relationship to median income for those economies.
Also it is becoming harder to justify home ownership from a purely economic perspective in comparison to the costs/benefits of renting.
It is only when you can add in a sizable capital gains amount to the future cash flows from home ownership that buyers will be tempted back into real estate. Being able to factor in periodic capital gains into the cash flow analysis of course alters the affordability calculations as it is somewhat equivalent, or at least was perceived that way, to having supplementary income that increases one’s ability to service the mortgage costs.
Critically, it is the re-emergence of even a nascent housing bubble that needs to kick in again to drive this “multiplier” and this must surely be the hidden agenda of all of the government rescue plans. Whether or not it will work is unclear but what is most alarming is that if it does it will only be sewing the seeds for another credit crisis down the road.
Fundamentally it will fail to address the real problem with the housing sector, and many other parts of the economies of the developed world, which is that they are nowhere as rich as they think they are and for most of their citizens the realization has to come that, even at current depressed levels they simply cannot afford to own their own homes.
This will remain the case unless real estate prices come down a lot further still or incomes for average workers go a lot further up.
Alas, neither of these options is easy for politicians to sell so the recession that ultimately hinges on finding some bottom to home prices may have to continue long enough for Wall Street to come up with a new daisy chain to resurrect the mortgage-backed securities market.
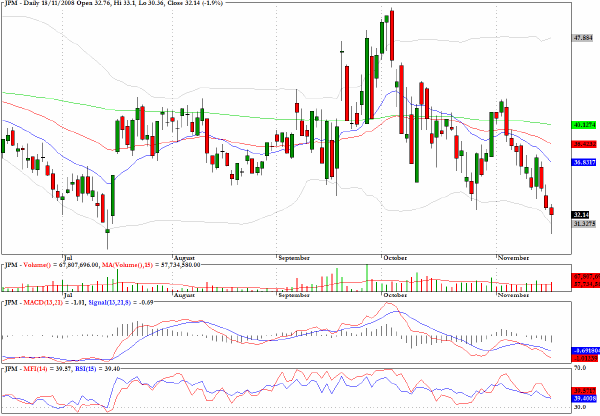
In addition to Citigroup (C), Bank of America (BAC) and Goldman Sachs (GS), which seem to fall every day, the chart for JP Morgan shows that yet another of the blue chip financials is in a somewhat precarious condition.
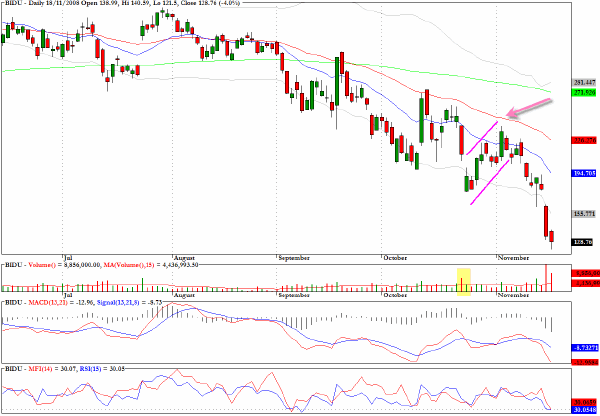
At the end of October I commented on the following:
Baidu (BIDU) has rallied back in a flag-like formation that could be ripe for a sudden setback as it encounters the 20-day EMA.
Often it makes sense to hold on to at least half of one's position when there are such clearly demarcated technical patterns.
Clive Corcoran is the publisher of TradeWithForm.com, which provides daily analysis and commentary on the US stock market. He specializes in market neutral investing and and is currently working on a book about the benefits of trading with long/short strategies, which is scheduled for publication later this year.
Disclaimer
The purpose of this article is to offer you the chance to review the trading methodology, risk reduction strategies and portfolio construction techniques described at tradewithform.com. There is no guarantee that the trading strategies advocated will be profitable. Moreover, there is a risk that following these strategies will lead to loss of capital. Past results are no guarantee of future results. Trading stocks and CFD's can yield large rewards, but also has large potential risks. Trading with leverage can be especially risky. You should be fully aware of the risks of trading in the capital markets. You are strongly advised not to trade with capital.
|