| Corcoran Technical Trading Patterns For November 20 |
| By Clive Corcoran |
Published
11/20/2008
|
Stocks
|
Unrated
|
|
|
|
Corcoran Technical Trading Patterns For November 20
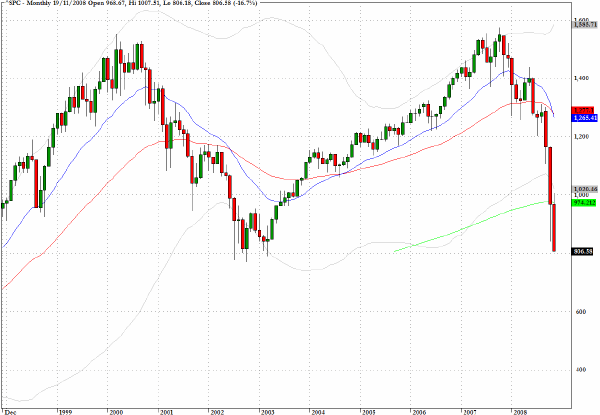
The S&P 500 has almost completed the retreat to the 2002/3 lows which I have been anticipating in this column for several months. The intraday low on the cash index reached 806.18 and I suspect that we need further attrition to test lower levels nearer to 2002 lows around 770 before making a further interpretation of the technical condition for US equities and the longer-term outlook.
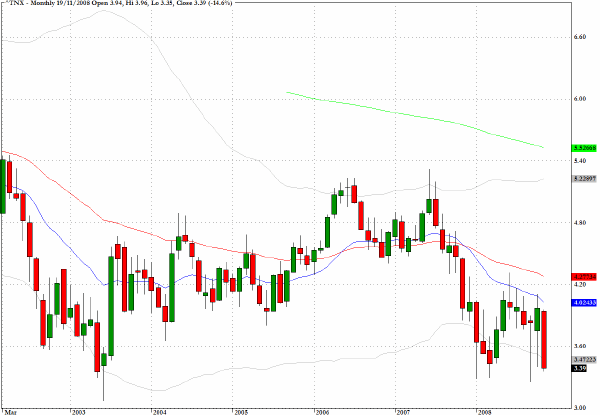
Yields on the ten-year Treasury note (^TNX) continued down again after the break in the trend-line noted in yesterday's commentary. Also evident on the long term monthly chart is the fact that the 2003 lowest yield just above 3% could be targeted.
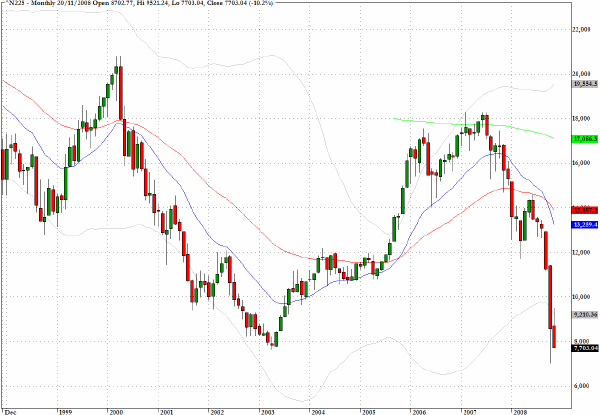
In trading Thursday morning in Asia, there was widespread selling and it was the Nikkei which saw the largest drop of 7%. It appears that the recent panic low, which took the index to levels not seen for 26 years, needs to be re-tested.
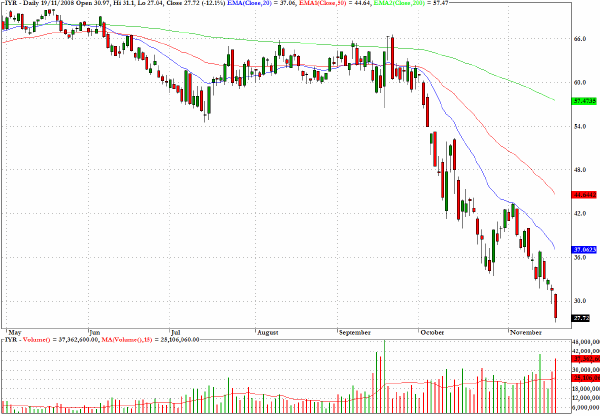
In my comments yesterday I noted that the sector fund IYR which tracks the Dow Jones Real Estate index was showing no signs of continuing price erosion and we saw another 12% fall yesterday.
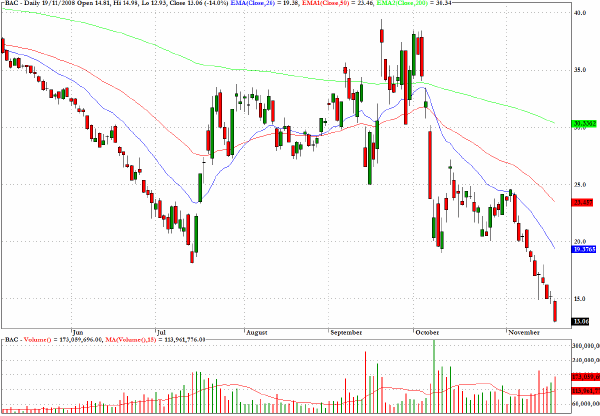
The major banks are crumbling, with Citigroup registering a 23% drop yesterday and my focus stock, Bank of America (BAC), confirmed yesterday with its 14% drop the reliability of the signals based upon a violation of the baseline of a descending wedge pattern.
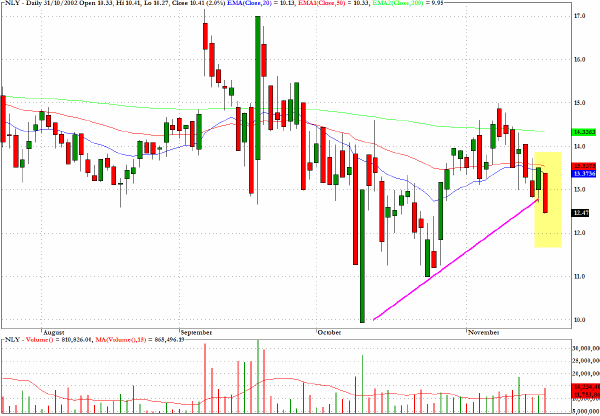
The drop down from overhead resistance from two moving averages for Annaly Capital Management (NLY) has violated the uptrend line indicated and suggests that there could be a revisit to recent lows.
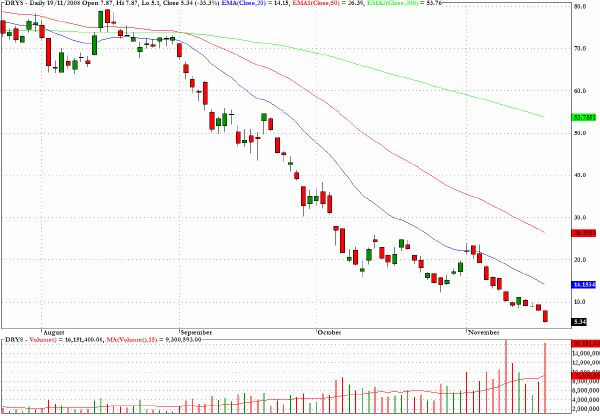
The chart for Dryships (DRYS) is one of the most spectacularly bearish in a market where one is spoiled for choice in selecting suitable candidates for that role.
I would be very wary on the short side for such a high beta stock and at some point a very sharp rally is to be expected.
Clive Corcoran is the publisher of TradeWithForm.com, which provides daily analysis and commentary on the US stock market. He specializes in market neutral investing and and is currently working on a book about the benefits of trading with long/short strategies, which is scheduled for publication later this year.
Disclaimer
The purpose of this article is to offer you the chance to review the trading methodology, risk reduction strategies and portfolio construction techniques described at tradewithform.com. There is no guarantee that the trading strategies advocated will be profitable. Moreover, there is a risk that following these strategies will lead to loss of capital. Past results are no guarantee of future results. Trading stocks and CFD's can yield large rewards, but also has large potential risks. Trading with leverage can be especially risky. You should be fully aware of the risks of trading in the capital markets. You are strongly advised not to trade with capital.
|