| Corcoran Technical Trading Patterns For November 21 |
| By Clive Corcoran |
Published
11/21/2008
|
Stocks
|
Unrated
|
|
|
|
Corcoran Technical Trading Patterns For November 21
The S&P 500 (^SPX), along with other indices, took out vital support levels yesterday and closed at an eleven-year low. I shall focus on this index in a weekend analysis.
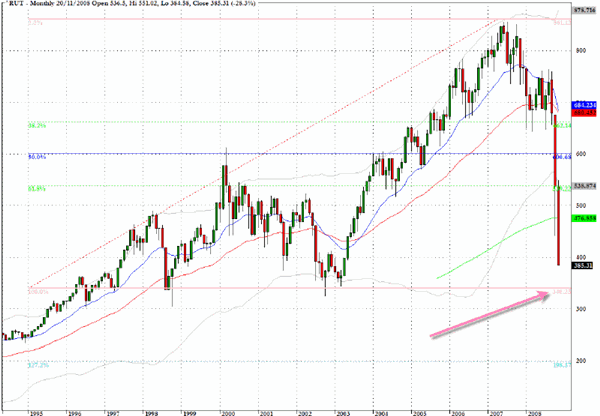
One chart that I want to look at today is for the Russell 2000 (^RUT) which has dropped more than fifty percent in the last 80 days.
The fibonacci retracements from strategic lows experienced during the 1990’s and the high from last October pivot at the 600 level, which is exactly the 50% retracement level and where other areas of chart support/resistance map quite cogently on to the fibonacci grid.
The target that I believe is now feasible in the intermediate term for this index is approximately 340.

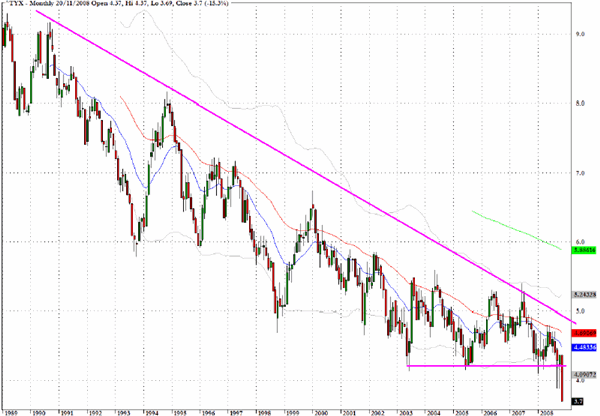
Yields on the thirty-year Treasury bond (^TYX) have fallen to their lowest levels and, as the very long-term monthly chart reveals, the drop below 4% fits surprisingly well into a massive long-term wedge pattern with the most recent baseline being decisively penetrated yesterday.
The action yesterday for the long bond captures the fear in the market place for which Mr. Paulson and his change of view on the purposes of the TARP must surely take a large part of the responsibility.

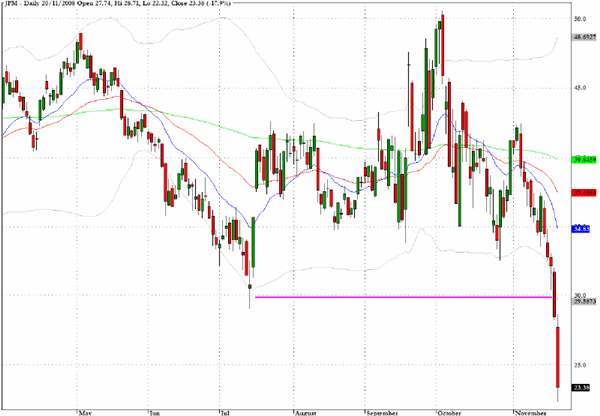
JP Morgan (JPM) is increasingly being seen as another troubled bank and yet again Mr. Paulson’s reluctance (or incapacity) to address the removal of toxic assets from banks' balance sheets has caused a sea change in this chart over the last several sessions.

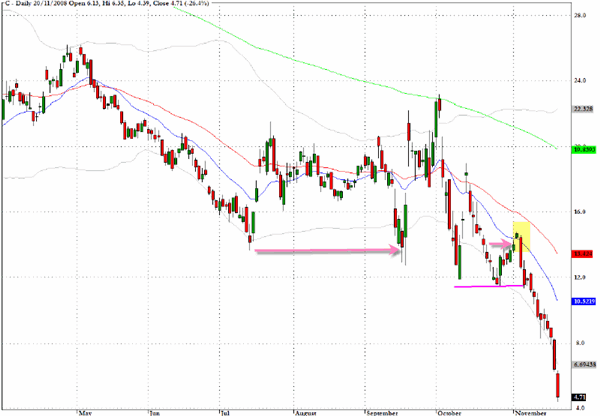
The announcement, before the market opened yesterday, that Saudi Prince Alwaleed Bin Talal had increased his stake in Citigroup (C) with a $300 million investment had all of the hallmarks of desperation.
Failure at Citigroup, precipitated by deposit withdrawals on a global basis, would even make Lehman’s demise seem tame by comparison.

Clive Corcoran is the publisher of TradeWithForm.com, which provides daily analysis and commentary on the US stock market. He specializes in market neutral investing and and is currently working on a book about the benefits of trading with long/short strategies, which is scheduled for publication later this year.
Disclaimer
The purpose of this article is to offer you the chance to review the trading methodology, risk reduction strategies and portfolio construction techniques described at tradewithform.com. There is no guarantee that the trading strategies advocated will be profitable. Moreover, there is a risk that following these strategies will lead to loss of capital. Past results are no guarantee of future results. Trading stocks and CFD's can yield large rewards, but also has large potential risks. Trading with leverage can be especially risky. You should be fully aware of the risks of trading in the capital markets. You are strongly advised not to trade with capital.
|