It seems like everyone has become an energy pricing expert in the last two months, and in some ways, they probably have. Oil prices have hit all-time highs within the last few weeks, then the devastation of hurricane Katrina and the rekindled oil worries of hurricane Rita put crude prices back on the run. And even if you have no interest in oil prices, the hefty fees you're paying at the gas pump are starting to take a toll. At this point, the question is just how much worse can it get? From a very broad perspective, our answer is 'not very'. That's not to say we won't see spurts of price surges, or even oil prices persisting at current levels. However, after the last month, it's difficult to see things (prices) getting any worse than they already have.
Admittedly, it's not just the charts that look like they're peaking. Since the middle of the year, the media time and attention devoted to oil and gas prices seems to have grown exponentially. We're now seeing the topic creep into TV shows and media sources that would never touch on the subject before. From our contrarian point of view - now that literally everyone is on board with the fact that oil prices are rising - the time has come for that trend to wind down. (As a prior contrarian example, back in late 1999 and early 2000, everyone was convinced that there couldn't have been a better time to be in the market. Talk about being wrong!)
But first and foremost, we're chartists. So today we'd like to briefly look at the charts of the most important energy components. Let's just see if the charts are confirming all the hysteria that's being generated by the media, pundits, and "in the know" neighbors.
Crude Oil
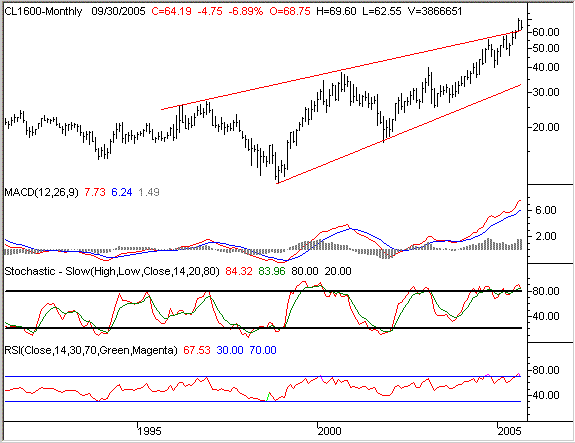
We wanted to back out to a monthly chart here, just to put it all into perspective. We also chose a monthly chart ti drive home an important point we made above - that this is a longer-term idea. In other words, we can't get consumed by the day-to-day fluctuations that may make oil look like it's going even higher.
In a nutshell, crude oil looks stretched to the max. In fact, The futures are well under the high of 70.90 we saw two weeks ago, and they're heading even lower today? But what about all the damage that Rita was supposed to do? That's exactly our point! Granted, Rita turned north and didn't hit all the Texas refineries as hard as some had predicted, but even if it had, the likely damage was a bit overstated. It's difficult to cause major damage to a refinery. They can't operate underwater (obviously), but these oil companies aren't going to risk a loss of revenue by building flimsy machinery. The hype of lost oil production was largely overdone, which we're already confirming today with another 1 point drop in oil prices.
As for where crude prices might end up, there's a long-term support line currently at 32.50. We don't want to get that aggressive yet, but it wouldn't be out of the question to see crude hit that mark at some point in the distant future. In the meantime, oil is well into overbought territory (stochastics and RSI), and even the MACD lines are at levels we've never seen before. We think oil prices could ease back into the $40 to $50 range. Oil stocks should move accordingly.
Crude Oil Futures - Monthly

Heating Oil
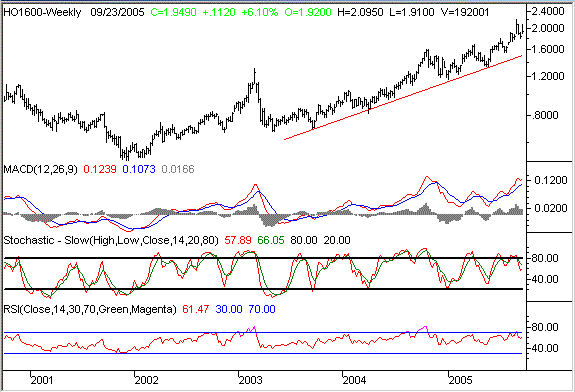
Heating oil doesn't look quite as over-extended as crude oil does. As long as this price increase stays contained (and doesn't surge out of control), we could see heating oil prices creep up into the mid-2's. That said, the current reading of 2.00 is still a bit of a ways above the longer-term support line. So, we'd feel better about buying on a dip rather than trying to jump in now....as long as that support line holds. Be careful here, though, because of seasonal pressures. The pre-winter season is when heating oil production is being wrapped up, and storage tanks are being filled. Thus, it's the time when the demand seems to be bigger than supply. One of the concerns about this year is that the supply/demand problem isn't just a perceived one - supplies really are tight. The refiners have devoted a major amount of time and effort to meet auto fuel and diesel fuel demands, and haven't had a chance to priced heating oil as much as they'd like to. That could be a catalyst for a heating oil run that occurred before a dip back into the 1.60 area.
Heating Oil - Weekly

Natural Gas
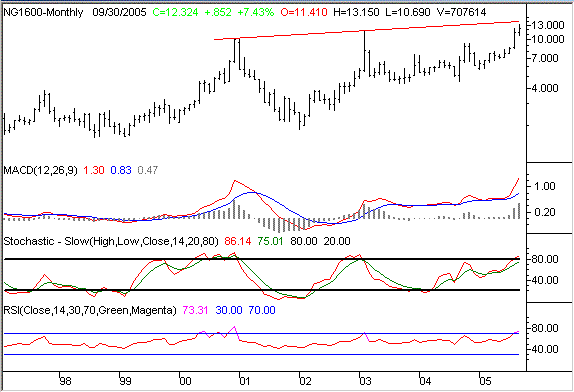
As for natural gas, we'll back out to a monthly chart again to illustrate the long-term resistance that looms just above the current price of 12.40. Natural gas hit peaks, and made huge downside reversals in December of 200 and February of 2003. Extending those peaks out to today, you get a resistance line right around 14.00. We've seen 13.15 already this year, but there's still 85 cents or so worth of potential for natural gas prices. After that, we have to think the pattern will repeat itself. And for our money, the risk of planning on that small increase in natural gas is far greater than the risk of betting that it's already peaked. In either case, we'll sit tight and let the market tell us what's next - we just think it's going to be tough for natural gas to get any further extended than it already is.
Natural Gas - Monthly

So all in all, energy prices and energy-related stocks look like they're under a lot of pressure. That's not to say that they can't go higher form here, but it's going to be tough to do, with all those profits to be taken (and all that resistance overhead). And if for some reason energy prices do manage to break past resistance (or make new highs, or accelerate, or whatever), it could be the bullish breakout of the decade. That, however, is the less likely scenario.
Price Headley is the founder and chief analyst of BigTrends.com.