| The McMillan Options Strategist Weekly |
| By Lawrence G. McMillan |
Published
11/21/2008
|
Options
|
Unrated
|
|
|
|
The McMillan Options Strategist Weekly
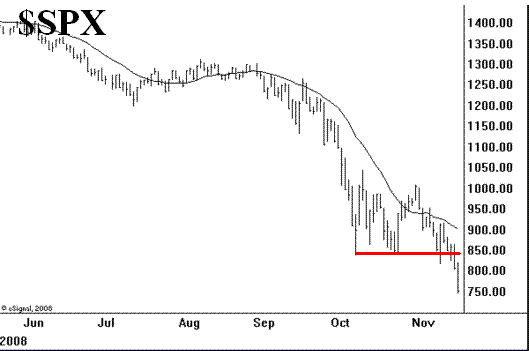
Selling has accelerated once the $SPX October lows at 840 were taken out. The first wave of selling -- from mid-August into mid-October was a decline of 35% (from 1300 to 840, roughly). Many analysts thought that was the bottom because of the historic oversold conditions that existed at the time. That included a mini-crash of 220 $SPX points in a mere seven trading days, attributable heavily to the margin calls issued to hedge funds and other leveraged trading companies.
However, the economic situation has done nothing but get worse, and so an entirely new bout of selling has taken place. Since the highs at 1007 on election day (November 4), $SPX has plunged another 260 points, or 26%, since the election of Barrack Obama. In just the last five trading days, we've had literally another mini-crash, with $SPX dropping 18% in a week -- and that may continue, since there was no sign of a bottom today (Thursday).
This bear has served notice that it is fiercer than anything in recent memory. $SPX plunged through the lows of the 2002 bear market and is now trading at prices last seen in the spring of 1997. Nearly 12 years of market gains, including one of the biggest bull markets in history, have been wiped out. The Dow isn't quite that bad, as it hasn't fallen below the 2002 lows yet.
What I find totally amazing about these events is that the monstrous oversold conditions of October had little or no effect generating a putrid, weak rally which was aided heavily by the October Seasonal Bullish period. For new lows to be made and for such heavy selling to take place on the heels of those October oversold conditions is virtually unthinkable. Last summer, we were totally unimpressed with the July-August rally following heavily oversold conditions in July. That lead to the huge declines we've had since August. Now, the rally after October was even worse and the October oversold conditions were more severe than July's. Does that mean that the November decline -- which we are now in -- will be worse than the August-October decline? As hard as that might be to believe, it's certainly possible.

None of our indicators is positive, despite promising setups that existed a couple of weeks ago. It was the $SPX chart that kept us from turning bullish then. Currently, on the $SPX chart, all the trends are downward, including that of the declining 20-day moving average.

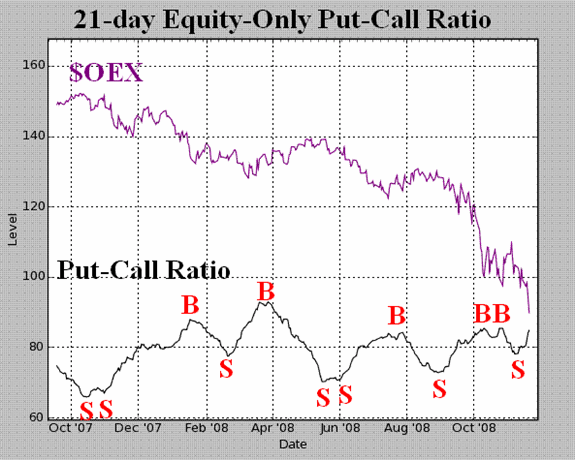
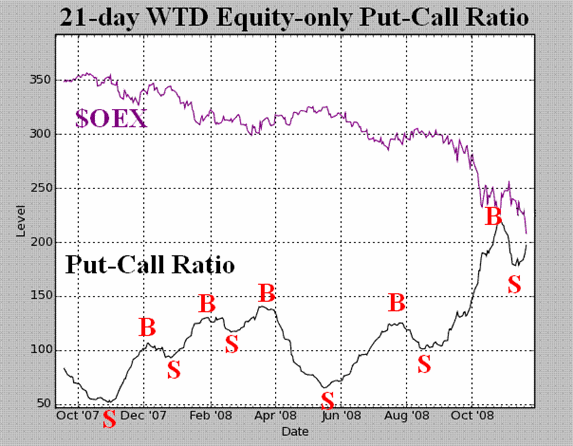
The equity-only put-call ratios had given confirmed buy signals a few weeks back, but those have now been canceled -- and sell signals reinstated -- as the ratios are rising again. As long as they continue to climb, they will remain bearish. It should be noted that they are very high on their charts (i.e., oversold).

Market breadth has been so bad of late that the breadth is historically oversold. But for breadth indicators to actually turn positive would take many days of improving breadth, with advances leading declines. That doesn't seem likely to happen soon.
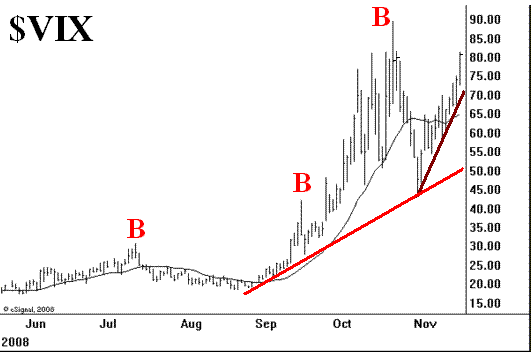
The volatility indices ($VIX and $VXO) have trended higher as the market declines. $VIX would have to fall below 65 in order to violate the current uptrend (see Figure 4), and even then the longer-term uptrend would still be in effect.

In summary, all indicators are on sell signals so this bear market remains in full force. However, all are oversold and some are more oversold than they ever been. Thus, a sharp, but short-lived oversold rally is certain possible rally.
Lawrence G. McMillan is the author of two best selling books on options, including Options as a Strategic Investment, recognized as essential resources for any serious option trader's library.
|