| Outlook On The Stock Indices |
| By Price Headley |
Published
11/22/2008
|
Futures , Options , Stocks
|
Unrated
|
|
|
|
Outlook On The Stock Indices
NASDAQ Composite
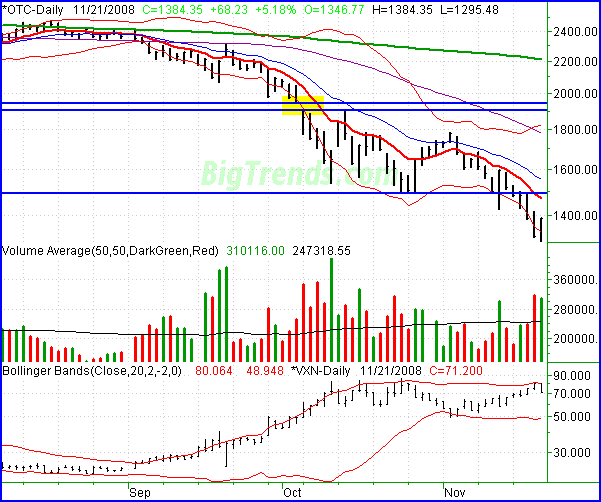
The NASDAQ lost another 5.18% on Friday (+68.23 points) to end the day at 1384.35. The week was still a disaster though; the index lost 8.74%, falling 132.50 points below the prior week's close...one of the worst weeks ever. Though Friday offered a little bit of hope, it was nothing more than a dead cat bounce so far.
Though only a dead-cat bounce, it was still a high volume bounce -- one of the highest volume days we've seen in a while. Maybe it was a fluke, or maybe it was just the effect of expiration. Or, maybe it was the legitimate beginning of a new bull market. The only way we'll really know is to observe the coming week.
We need to get and stay above 1600 to give the bulls a shot at going somewhere. And ideally, the NASDAQ needs to move above 1950 of the rally is to have any longevity. That would close a key gap as well show a persistent attack on the upper Bollinger band (as opposed to just using it as a reversal point). Anything under that is just volatility. Bear in mind there's a lot of room for bullish volatility though -- enough to trade anyway.
The VXN is headed lower now, thanks to running into resistance at its upper band. Now we're watching for potential support - again - from the VXN's lower band at 48.95. That lower band was where trouble began for the composite back in early November. The VXN needs to keep driving that band lower for the stock rally to last. Needless to say, we're not getting too excited about Friday's rally just yet. We've seen it before to no avail.
NASDAQ Composite Chart - Daily

S&P 500
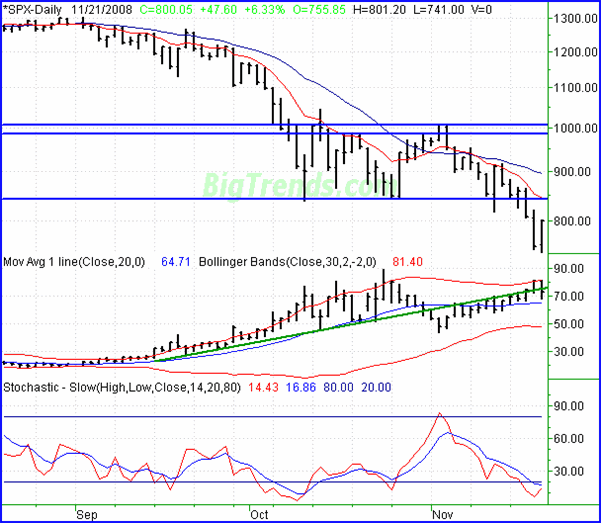
The close of 800.05 on Friday for the S&P 500 was the result of a 47.6 point (+6.33%) bounce. However, for the week, the large cap index still managed to fall 73.25 points (-8.39%). But hey, it could have been worse. Now let's see if the market can pick up where it left off and actually make a gain on Monday. If it does, it would be the first time in several weeks we saw two decent days made back to back.
Conventional wisdom would say take note of the fact that the market hit new multi-year lows on Friday. That rarely happens, but when it does is usually an omen of worse things to come. The problem is, this market has been anything but conventional.
Friday was evidence of that. More important, Friday was a hint that -- despite it all -- investors still want to be buyers here. They just need a decent excuse. Apparently a new Treasury secretary is enough. Of course, we could have gotten a dead cat bounce no matter what, so don't get too excited just yet. We need a little follow through to make any bullish assumptions.
How much bullish follow through? Let's cross the 10-day average for starters. It's at 843, which is also where the previous support level was. The upside here is that the market is clearly oversold, and stochastics is about to give us a short-term buy signal. The only caveat we'll mention is what happened in late October and early November. The market pushed above the short-term averages for a couple of days, than wham -- on to new lows. So, take it all with a grain of salt.
That said, the VIX so far is playing along. The VIX hit its upper Bollinger band on Thursday, and pointed south on Friday. If this really is a ceiling for the VIX, then stocks have a prayer. It's a limited time prayer though. If the VIX finds a floor about the same time the SPX stalls at one of several resistance levels, any bullishness could quickly fade.
Only when the VIX starts to push the lower band lower, and when the S&P 500 is above the 20-day moving average line, can we start to fully entertain a bullish possibility.
S&P 500 Chart - Daily

Dow Jones Industrial Average
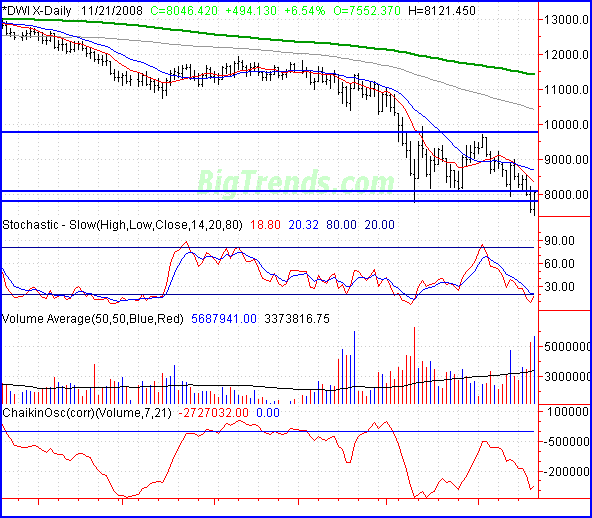
Friday's 494.13 point gain (+6.54%) was nice. Too bad it still left the Dow well under the prior Friday's close. On a weekly basis, the Dow still lost 450.89 points (-5.31%) to end at 8046.42 -- just a day after hitting 11 year lows. At least the week ended on a high note though, let's see if it lasts.
There's nothing new to mention for the Dow's chart other than the fact that Friday's volume was significant -- a little larger than the volume behind Thursday's sell-off. Though we've seen more bearish days over the last two weeks, the three bullish days we've seen have all been strong accumulation days. This points to potential, even if untapped so far.
Like the S&P 500, the Dow is stochastically oversold, but likely on the verge of correcting that problem. If both the %K and %D lines (the two moving lines on the stochastic chart) cross back above 20, we'll get bullish in the short run. However, the Dow needs to get above 8700 -- and really above 1000 -- before we can talk about the bigger trend changing. We're due though.
By the way, lower lows next week would be bearish. To clean up any lingering dead weight, all the market had to do was fall under 2002's lows, which it did. If it keeps falling, then it wasn't dead weight it needed to shed i I's just still getting itself properly valued, though stocks are cheaper now than they've been in the last 15 years.
Dow Jones Industrial Average Chart - Daily

Price Headley is the founder and chief analyst of BigTrends.com.
|