| Post-Expiration Reversal? |
| By Price Headley |
Published
11/24/2008
|
Stocks , Options , Futures , Currency
|
Unrated
|
|
|
|
Post-Expiration Reversal?
After the carnage last week in the markets, you might be wondering where we are likely to go from here. People often try to pick bottoms in an attempt to buy into a stock right when it is beginning into its big bullish run. As you likely know, picking bottoms can be challenging, if not outright impossible, not to mention being a waste of your time and your capital. Read on to learn about what history tells us that this week will bring.
Last week was important for option traders as the November stock options expired. Expiration week can often bring added volatility as traders look to unwind their positions before the close on Friday.
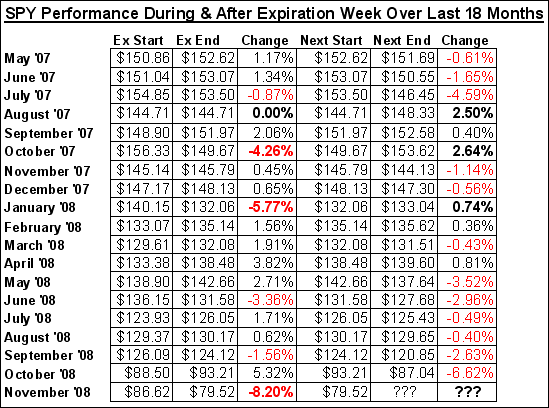
With expiration now in the past, let's now look forward. Taking a look at the chart below, we can try to gain some information about the performance of the S&P 500 the week following expiration.

The chart shows the last 18 months of the performance of the SPY during expiration week, and then the SPY's performance the following week. There are a few points to take away from these numbers.
1. 11 of the last 18 times, the performance after expiration has been in the opposite direction of during expiration. Although this is slightly over half of the time, it does show us that the market can get over extended one way or the other during expiration, and often needs to turn back in the other direction to correct itself.
This has especially held true 9 of the last 13 times (69%) since November of 2007.
2. Volatility recently has gone through the roof. We all are familiar by now with the VIX, the CBOE Volatility Index. As we have been documenting for the past 5-6 weeks, the VIX has remained in "extreme" territory, allowing these 400+ point moves on the DOW that we have become accustomed to.
The chart also shows us how the volatility has picked up since September. Over the last 18 months, the average expiration week performance has been 0.42%, and the average next week's performance has been -1.01%. Taking a look at the numbers from the past two months, they have been extremely bullish or extremely bearish, with no middle ground.

And last week's 8.2% drop in the SPY showed that not only is this trend continuing, but it is accelerating.
3. This week's performance is likely to be convincingly bullish. Last month we gained 5.32% on the SPY during expiration week only to give it all back when we dropped 6.62% the following week.
November is poised to reverse that performance after dropping 8.2% last week. I am expecting a strong rally of 7%-9% to gain back all of last week's losses. Some of the strongest next week performances have been after strong selling as shown in bold on the big chart above.
When market volatility increases, it is a great opportunity to review your trading strategies and look at historical market examples. The market, like world history, tends to repeat itself, and those who can spot those trends are going to be the most profitable. Make sure you are on top of your trading knowledge and expertise so that you are prepared to navigate these volatile waters and emerge with large profits.
Price Headley is the founder and chief analyst of BigTrends.com.
|