| Corcoran Technical Trading Patterns For November 25 |
| By Clive Corcoran |
Published
11/25/2008
|
Stocks
|
Unrated
|
|
|
|
Corcoran Technical Trading Patterns For November 25
Yesterday was one of the easier days to take some decent day-trading profit from the market on the long side. The session started well and, apart from some bouncy castle moments towards the close, there were plenty of stocks that could have delivered double digit returns.
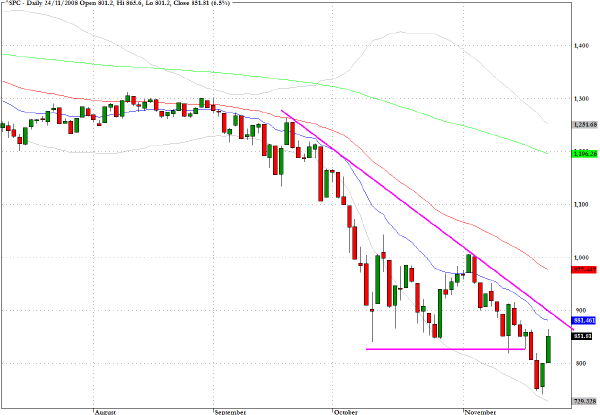
The S&P 500 (^SPC) managed to close just above the 850 level and should have some further upside potential, although as I have indicated on the chart there will be more liquidations and de-leveraging at the obvious lines of resistance.
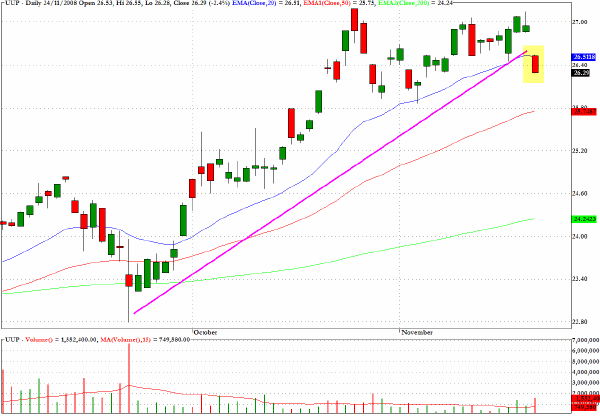
I'll be watching the US dollar closely in coming sessions and the most useful indicator, which can be traded, is the ETF that represents a bullish view on the Dollar Index, i.e. UUP.
Coordinated inter-market strategies are starting to reveal themselves again as risk aversion appears to have diminished somewhat. The Citigroup deal has undoubtedly provided another dimension to the safety net under the banking sector and with this new layer of public sector underwriting of the default risk, notwithstanding the distress still being felt by many hedge funds, we should expect to see a slightly more benign environment for renewed asset class speculation.
The way that the matrix of asset speculation may unfold in terms of inter-market strategies is laid out in the discussion regarding gold.
In my opinion this will not be an enduring phenomenon until the market truly does believe that the worst of the recession has been "discounted". But during the plateau periods when more cheerful sentiment prevails, this inter-market asset play will need to be reckoned with.
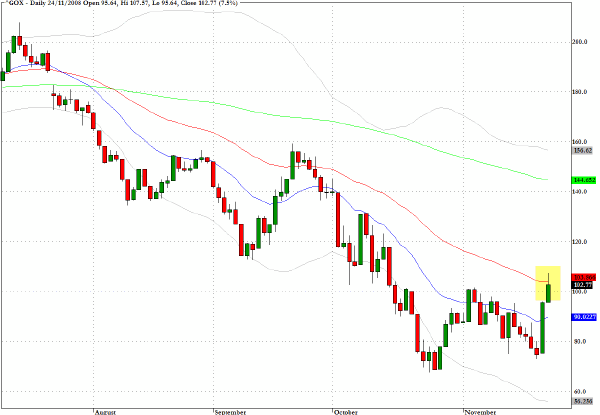
The Gold Index (^GOX) made it exactly to the 50-day EMA as discussed here yesterday. Attention will now focus on the dollar and the price of the precious metal.
Longer term, I suspect that there could be a sense in which recovery in US equities will tend to find itself snookered by the following inter-market play:
Less Risk Aversion -> Higher US Equities Prices -> Lower Long-term Treasury prices -> Lower Appetite for US dollars -> Higher Gold, Oil and other hard asset prices.
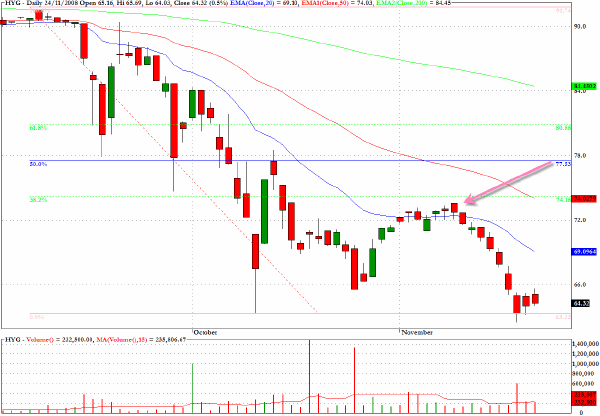
One other key indicator to monitor in terms of the market's appetite for risk and the extent to which the recession has been fully discounted is provided by HYG, an ETF which tracks the high-yield corporate bond market.
If the index which the sector fund tracks can break above the point indicated by the arrow on the chart, this would suggest that the Armageddon merchants may be changing their view.
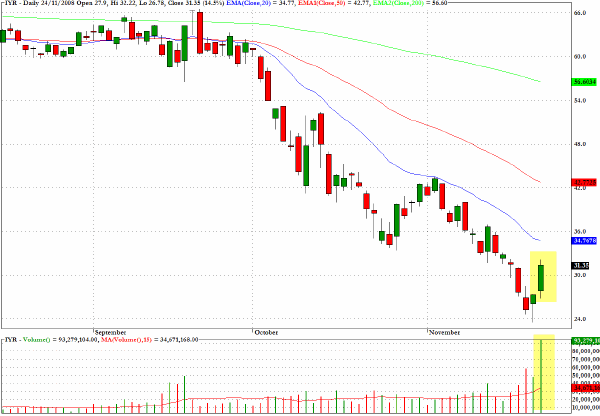
IYR, which tracks the Dow Jones Real Estate Index, saw three times its average daily volume yesterday as it surged ahead by almost 15%.
Perhaps just a dead cat bounce but another move to at least $36 seems imminent.
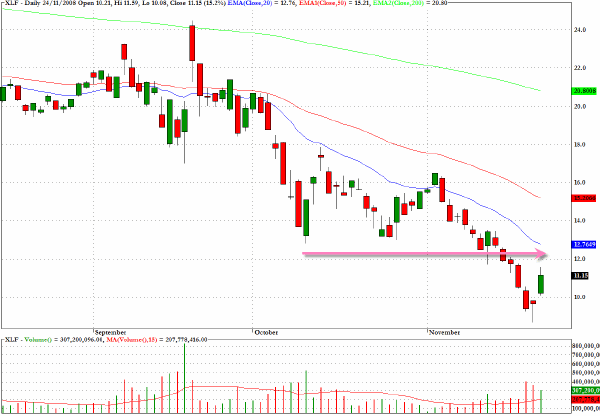
The bounce for the financial sector fund XLF was substantial in price terms even if the volume was not overwhelming. The $12.50 level looks like a target for the coming sessions.
Clive Corcoran is the publisher of TradeWithForm.com, which provides daily analysis and commentary on the US stock market. He specializes in market neutral investing and and is currently working on a book about the benefits of trading with long/short strategies, which is scheduled for publication later this year.
Disclaimer
The purpose of this article is to offer you the chance to review the trading methodology, risk reduction strategies and portfolio construction techniques described at tradewithform.com. There is no guarantee that the trading strategies advocated will be profitable. Moreover, there is a risk that following these strategies will lead to loss of capital. Past results are no guarantee of future results. Trading stocks and CFD's can yield large rewards, but also has large potential risks. Trading with leverage can be especially risky. You should be fully aware of the risks of trading in the capital markets. You are strongly advised not to trade with capital.
|