| Corcoran Technical Trading Patterns For November 26 |
| By Clive Corcoran |
Published
11/26/2008
|
Stocks
|
Unrated
|
|
|
|
Corcoran Technical Trading Patterns For November 26
It was an erratic ride for US indices yesterday with the S&P 500 (^SPX) providing almost as many thrills as the fairground. At the end of the day the candlestick registered on the cash index was a green spinning top whereas the formation on the exchange traded proxy SPY was a red hanging man. In the case of the more bearish signal - the hanging man - this appeared exactly at a chart line of resistance and almost touching the 20-day EMA for SPY.
Quantitative easing is the new terminology that is fast gaining favor in Washington and expressed in more prosaic terms it means that the printing presses are working overtime in a desperate attempt to reflate the ailing US economy.
Will policy makers exhibit the necessary good judgment to know when it is time to put the brakes on for this massive injection of liquidity?
The track record for the Fed on previous judgments about when it was appropriate to move away from overly lax monetary policy is not encouraging.
I wish all North American readers a very pleasant Thanksgiving holiday and I'll return on Monday December 1.
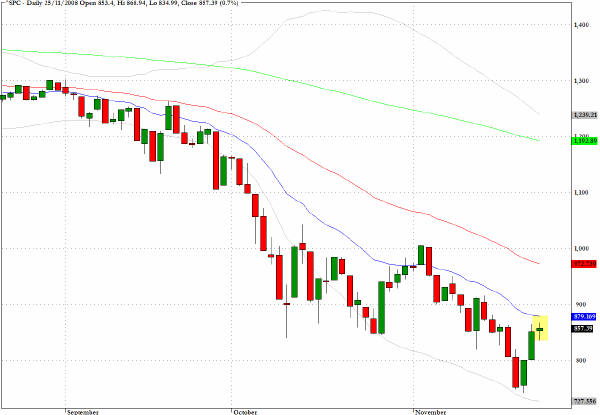
As commented yesterday, the US Dollar Index is showing signs that a correction is beginning. As one reader pointed out to me, there is an ETF that allows one to take a bearish view on the index, UDN, presumably U (DOWN) or one can simply short the other vehicle, UUP, U (UP). That's committed to memory now.
In simple round numbers, if we take $1.60 as the swing high on the Euro and $1.20 as the low, then the 38% retracement level comes out exactly to $1.35 which provides another round number as a probable target for the intermediate term.
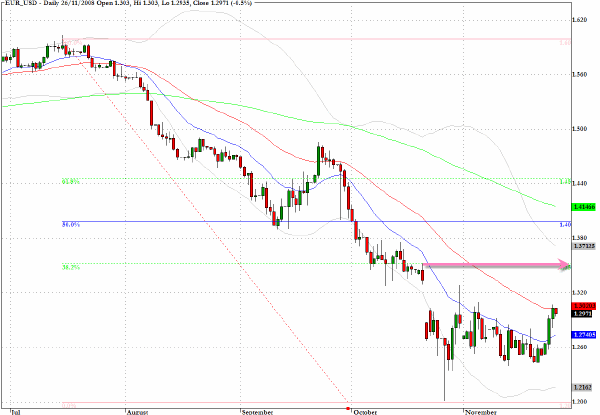
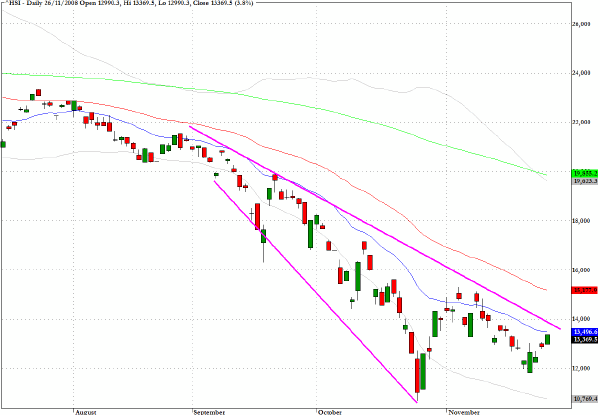
Not only are the US, UK and much of Europe now joining the reflation party but the Chinese government brought down its key interest rate substantially during trading in Asia on Wednesday. It provided an impetus to Hong Kong stocks which ended with a decent rally.
The pattern on the Hang Seng Index (^HSI) seen below could possibly be construed as a megaphone bottom by some technical analysts although I cannot confess to having studied the pattern too carefully.
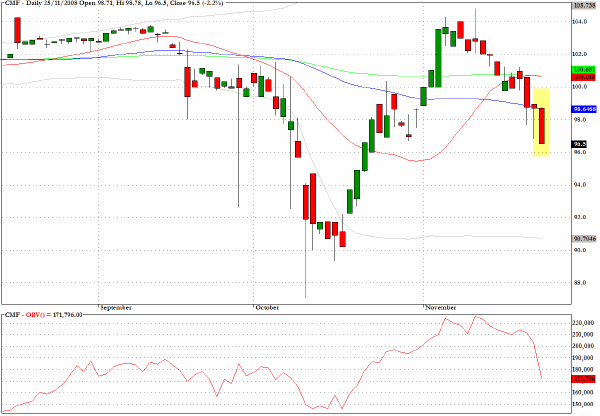
I drew attention in Monday's column to CMF, which is an exchange traded fund that allows one to express a view on the strength or otherwise of the municipal bonds of the state of California.
Last Friday's session saw a range expansion and a drop below key moving averages which I suggested looked bearish and yesterday saw a rather abrupt drop for this fund.
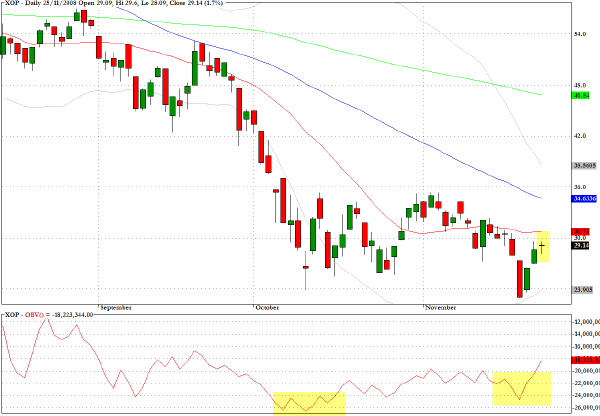
There are positive OBV divergences on the chart for the sector fund XOP which reflects prices for several energy exploration companies. There is no need to get anxious about this pattern getting away too quickly from here, but the pattern suggests that a basing pattern appears to be under way.
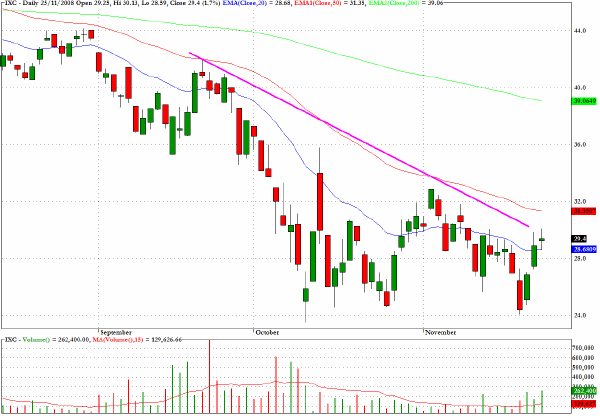
Not surprisingly many energy sector funds are mirroring the chart patterns to be seen for equities. IXC, which tracks the S&P Global Energy index, is looking poised to break above a key downward trend-line but it will almost certainly be taking its leadership from signs of continuing cheerfulness in the equity markets.
Clive Corcoran is the publisher of TradeWithForm.com, which provides daily analysis and commentary on the US stock market. He specializes in market neutral investing and and is currently working on a book about the benefits of trading with long/short strategies, which is scheduled for publication later this year.
Disclaimer
The purpose of this article is to offer you the chance to review the trading methodology, risk reduction strategies and portfolio construction techniques described at tradewithform.com. There is no guarantee that the trading strategies advocated will be profitable. Moreover, there is a risk that following these strategies will lead to loss of capital. Past results are no guarantee of future results. Trading stocks and CFD's can yield large rewards, but also has large potential risks. Trading with leverage can be especially risky. You should be fully aware of the risks of trading in the capital markets. You are strongly advised not to trade with capital.
|