| Outlook On The Stock Indices |
| By Price Headley |
Published
11/30/2008
|
Currency , Futures , Options , Stocks
|
Unrated
|
|
|
|
Outlook On The Stock Indices
NASDAQ Composite
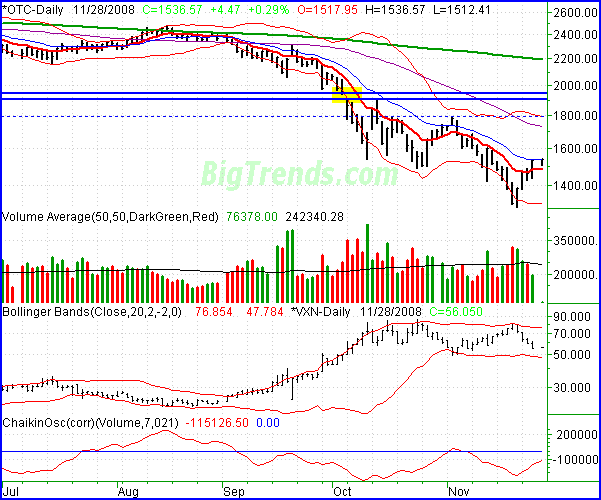
The NASDAQ Composite closed 4.47 points higher (+0.29%) on Friday, ending the session at 1536.57. For the week, the index ended up gaining 11.0% (+152.22 points). It's encouraging, though we'll also point out that the composite suspiciously hit an important resistance line.
That thin blue line is the 20-day moving average line. The NASDAQ has touched it without crossing it over the last two sessions. Why? We're not saying it's a sure-fire sign of bearish problem. We're just pointing out a concern for the bulls. We're actually bullish if we can just get past that hurdle.
As for an upside target here, we suspect the composite could reach 1790 (dashed line) if it can get just one more good shove. That's the peak level from early November, and is now where the upper Bollinger band (20-day) is.
Bigger picture, the bullish potential right now is huge, though it's still uncertain if it's going to be tapped now or later. If the composite can actually reach 1790, that will also mean it crossed above the 50-day moving average line for the first time since August. If that happens, it will be accompanied by a Chaikin line cross into positive territory -- another bullish biggie. However (and as we'll say for the VIX as well), the VXN has to help out by continuing to sink without plunging. Those plunges in the VIX (and bullish spikes for the market) have just invited profit-taking lately. If the market can make quite progress, it can be sustained.
Next week we'll look at a weekly chart, as the longer-term trend may have made an apparent shift by then as well.
NASDAQ Composite Chart - Daily

S&P 500
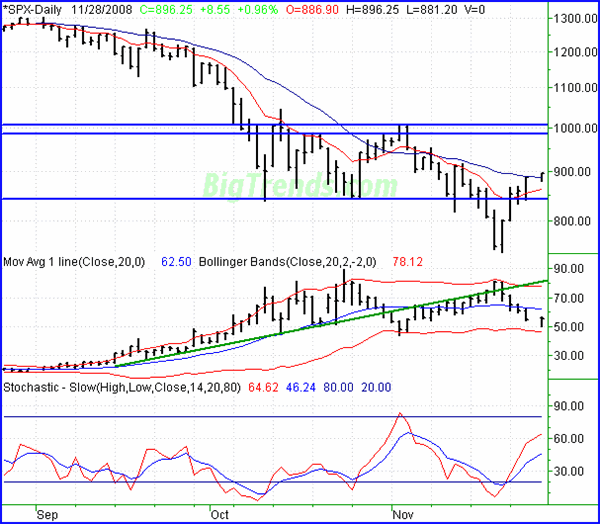
The S&P 500's +0.96%/+8.55 point gain for Friday's lethargic session meant a closing price of 896.25. That was 12.02% (+96.2 points) better than the prior week's close, and also made the large cap index the top performer last week. Moreover, it looks like the market could keep going for a little while.
What's bullish? Momentum. The S&P 500 closed above the 20-day moving average line on Friday for the first time since early November. And what's bearish? The last time (in October) the index closed above the 20-day moving average line, five days later we were headed to multi-decade lows. Of course we recovered as soon as those lows were hit, but it was a rough ride getting there. The concern is a repeat of that period, meaning this is just another fake-out move. It's not like Friday's push above the 20-day line had a lot of supporters.
On a semi-related note, the VIX is an even bigger concern. It's approaching the lower Bollinger band (20-day), which is a known and verified support area -- just see what happened November 4 and 5. We're actually not all that worried about the fact that the VIX moved higher on Friday. It was a very light day anyway, and it may have just drifted higher due to a lack of interest. However, until the VIX actually hits the lower band and continues to drive it lower, this rally is suspect.
If the market does keep going though, we're setting a near-term target of 1005 for the SPX. We can't set a downside target yet; we're more apt to look for a VIX reversal to know when the downside potential has been exhausted, if it plays out that way.
S&P 500 Chart - Daily

Dow Jones Industrial Average
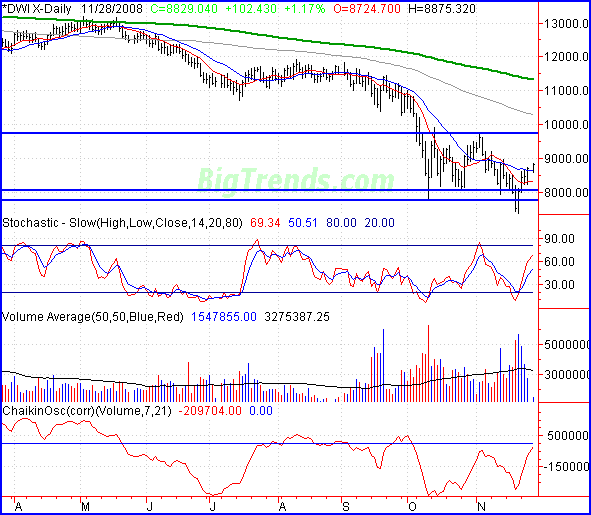
The 1.17% gain for the Dow Jones Industrial Average during Friday's shortened session (+102.43 points) left the blue chip index at 8829.04. That was 782.62 points (+9.73%) better than the prior Friday's close, yet there's still some room to keep rallying before a major headwind is hit. That headwind is 9711, the peak from early November.
Though the momentum and the volume have been more bullish than bearish, there's still a little red flag waving. The concern is just a possible repeat of the overbought/oversold pattern playing out since early October, and the 20-day moving average line (blue) is the center-line of the waffle. We crossed that line in early November, and then fell right back under it (and we were properly warned by the stochastic lines). We're not saying it's going to happen that way for sure this time; we're just saying we don't yet trust these bullish swings to have any duration. If the Dow successfully retest the 10- and/or 20-day averages, then we can be comfortably bullish.
Dow Jones Industrial Average Chart - Daily

Price Headley is the founder and chief analyst of BigTrends.com.
|