| Corcoran Technical Trading Patterns For December 1 |
| By Clive Corcoran |
Published
12/1/2008
|
Stocks
|
Unrated
|
|
|
|
Corcoran Technical Trading Patterns For December 1
Inter-market divergences are highlighting some contradictory messages coming from speculators in different asset classes.
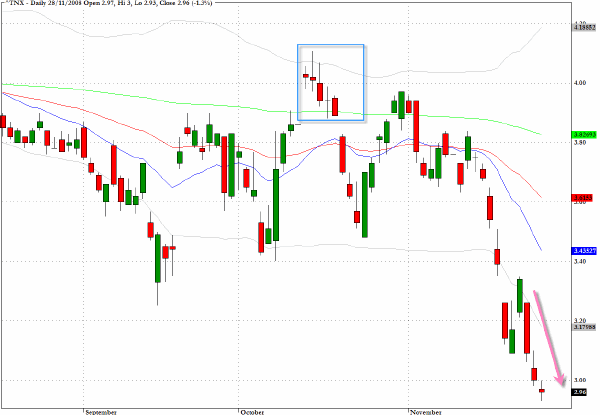
Yield on the ten-year US Treasury note has broken below the 3% level for the first time in more than 50 years, suggesting that fixed income investors are still seeking out safe haven assets. More revealingly, and to the extent that some kind of discounting logic explains the performance of market behavior (something I am becoming less convinced about), traders in the Treasury complex are not yet seeing across the valley to the same recovery play which is purportedly one of the underlying factors accounting for the stronger performance in equities since the key reversal on the S&P 500 which occurred on November 21.
There are institutional liquidity issues that are partly responsible for the slump in yields at the long end of the Treasury curve but while yields remain so low, one cannot resist the temptation to conclude that global asset allocators are still focusing on a very severe recession which still has a lot further to go.
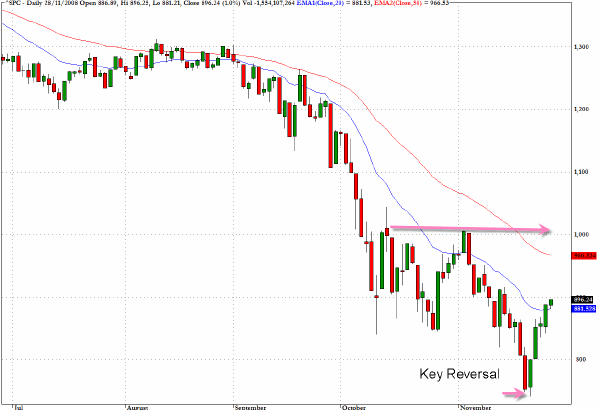
Despite some misgivings already expressed about the lack of a coherent view as to the nature of risk aversion across asset classes it appears that the reversal in the S&P 500 has signalled a tradeable rally ahead.
I would not get too comfortable with long-term position trading in equities at present but the 1000 level is a realistic target during the remainder of the year.
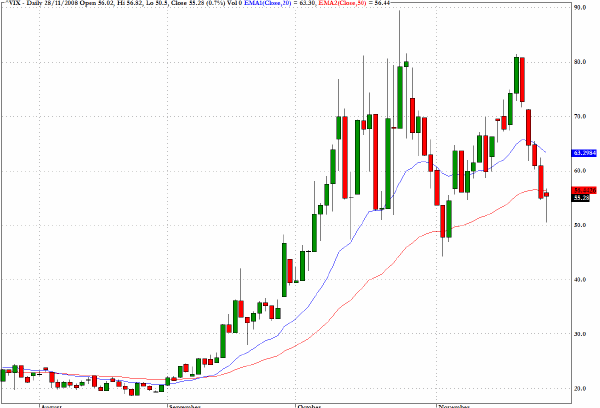
The CBOE Volatility Index (VIX) has retreated to the 50-day EMA level and for equity bulls faced with growing overhead resistance on most index and individual stock charts there has to be an expectation that working through these layers of supply will not cause another abrupt upward spike in this index.
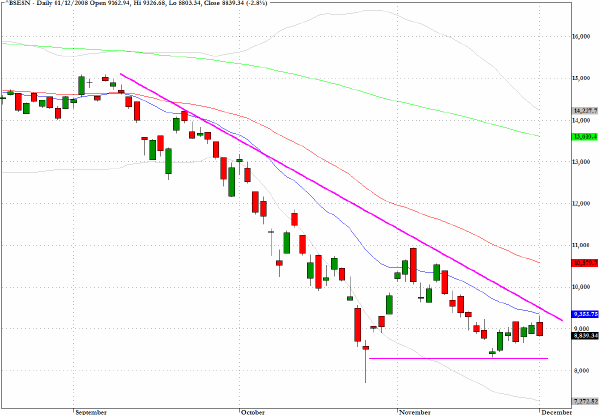
The dreadful atrocities that took place last week in Mumbai will pose some additional challenges for investors in emerging markets. The vulnerability of some new financial centers to attack opens up a new dimension to international terrorism.
The Mumbai Sensex (^BSESN) is struggling with a pronounced wedge pattern opening up the possibility that this index could break down further to lower levels.
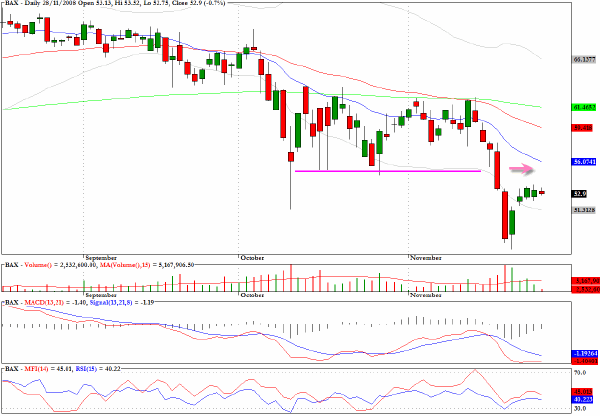
The chart for Baxter International exemplifies a pattern seen across many stocks, which is that there appears to be a lot of overhead resistance sitting not too far above the ascending recovery channel.
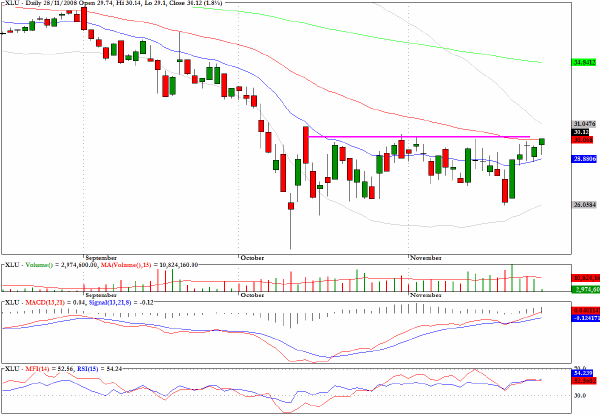
The utilities sector fund XLU appears to be in a basing pattern which coincides with the 50-day EMA. A breakout from the constricted range, as expressed by the narrowing of the Bollinger bands, could open the way for a move back to the 200-day EMA.
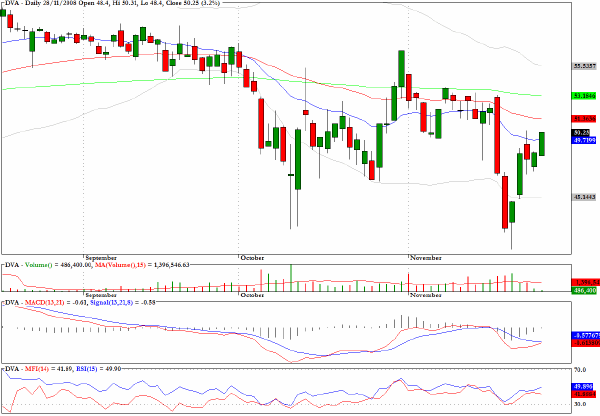
DaVita (DVA) also faces resistance from key moving averages.
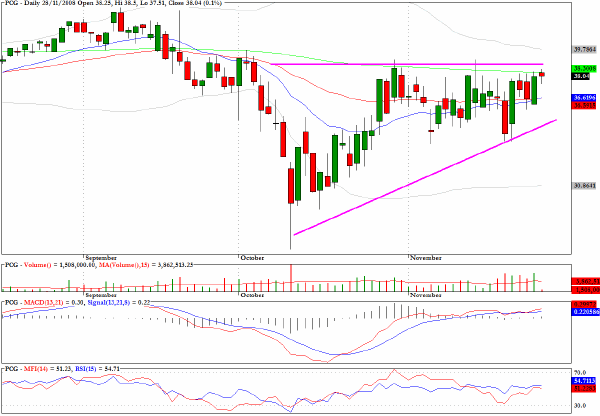
The upward wedge pattern on the chart for PG and E Corporation (PCG) is pointing to an imminent breakaway move.
Clive Corcoran is the publisher of TradeWithForm.com, which provides daily analysis and commentary on the US stock market. He specializes in market neutral investing and and is currently working on a book about the benefits of trading with long/short strategies, which is scheduled for publication later this year.
Disclaimer
The purpose of this article is to offer you the chance to review the trading methodology, risk reduction strategies and portfolio construction techniques described at tradewithform.com. There is no guarantee that the trading strategies advocated will be profitable. Moreover, there is a risk that following these strategies will lead to loss of capital. Past results are no guarantee of future results. Trading stocks and CFD's can yield large rewards, but also has large potential risks. Trading with leverage can be especially risky. You should be fully aware of the risks of trading in the capital markets. You are strongly advised not to trade with capital.
|