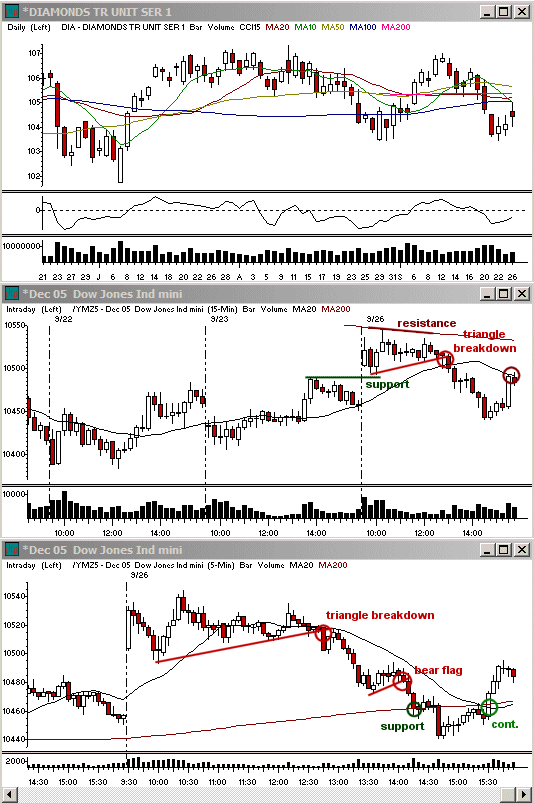
Good morning! The week kicked off with a rather slow start on Monday morning. After a gap up into the open, the market hit 15 minute 200 sma resistance pretty quickly in both the NASDAQ Composite and Dow Jones Ind. Ave. This stalled the upside move into the open and led to a pullback throughout the first half hour of the day, ending as the indices came into their 5 minute 20 sma support and the trading range from Friday afternoon.
The pace on the downside move out of the opening highs was on the strong side and the retracement of 50%+ from the move out of Friday's close helped create a narrow range throughout the morning. The 15 minute 200 sma served as resistance, while the 15 minute 20 sma served as support for the first several hours of the day. This range narrowed as volume declined into noon while the support and resistance levels converged. The range favored a break lower due to the rounded highs on the day when the market made very slightly higher highs in the range around 10:30 ET after two days of upside.
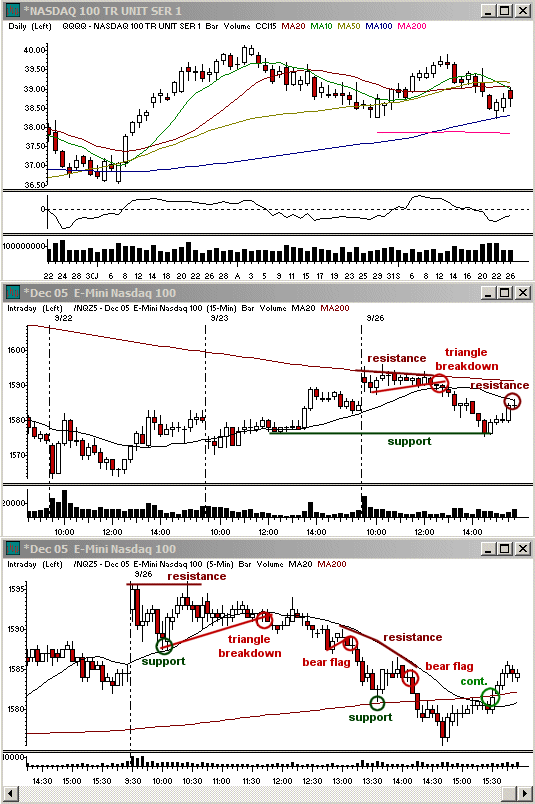
The market began to break lower out of the 12:00 ET reversal period. Initially the action was choppy, but the pace began to turn over more around 12:45 ET when the downside picked up. Volume remained light with the selling, however, indicating that it was just the beginning of a late day decline. The move continued out of the 13:00 ET reversal period and the 5 minute 20 sma served as resistance throughout the move lower. We saw a bit more correction at 13:30 ET when the 5 minute 20 sma support hit, but this just led to a 5 minute bear flag out of the 14:00 ET reversal period that took the market to new intraday lows and back into the range from Friday morning.
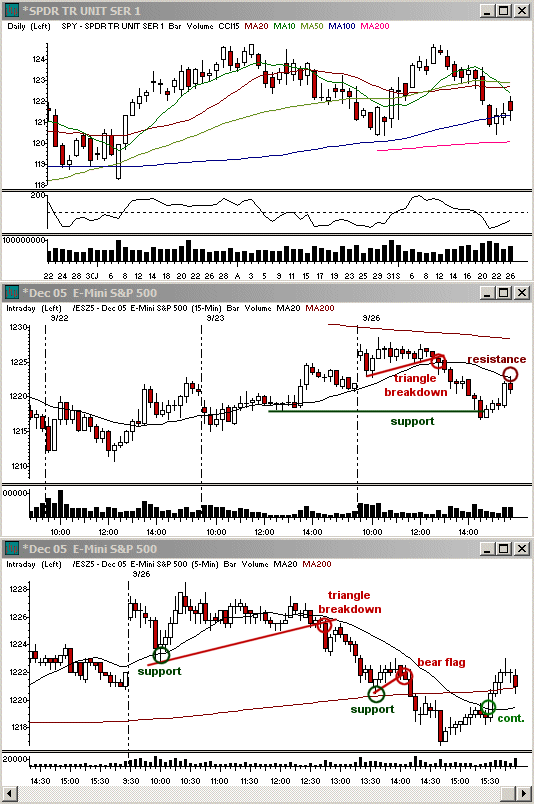
It was on this third wave of selling on the 5 minute charts since noon that we saw a bit more volume come in. It was still not extreme, but the trend placement intraday, combined with the larger 15 minute support, helped to turn the market over for the last hour of the day. Due to the stronger selling, the correction off lows got off to a slow start, but a small base at the 5 minute 20 sma helped to change the bias and allowed for a stronger move in the last half hour of the day. This took the market back to the highs of the 14:00 ET minute bear flag and the 15 minute 20 sma resistance just before the close.
Heading into Tuesday, my thoughts on the market are much as they were yesterday. Given the sharp decline into the support late last week, a correction from lows is likely to continue at a slower pace for the time being. There is a lot of overhead resistance to contend with at the moment, so I plan on continuing to focus more on the smaller intraday time frames for now. For swingtrades, I am primarily finding longs as a result of the daily market support, but many stocks basing at daily highs are getting pretty extended on the weekly and monthly charts, so be sure to pay attention to those larger time frames even if you are only looking to hold for a few days.
Updates: Swingtrades: VRTX from the 12th hit most trailing stops on Friday. Position trades: HSP and CHRS long have support at the lows of the weekly bases. CHRS stopped out some folks on Tuesday, but is holding the 20 week sma support. I am looking at acquiring NTRS as a position trade buy on upside breakouts from the current range on the weekly chart, but it needs to hold the 20 week sma level to stay on my watch list. HCA as a position trade short from 9/20 hit trailing stops for a swing, but a larger position trade target is in the $43 zone. UFPI long from Monday will have support at the 20 day sma, while PWAV long has support at $12.00. FRK is of interest for an upside breakout on Tuesday on the daily charts.
Economic Reports and Events
Sep. 27: Consumer Confidence for Sep. (10:00 am), New Home Sales for Aug. (10:00 am)
Sep 28: Durable Orders for Aug (8:30 am)
Sep 29: Chain Deflator-Final for Q2 (8:30 am), GDP-Final for Q2 (8:30 am), Initial Claims 09/24 (8:30 am), Help-Wanted Index for Aug (10:00 am)
Sep 30: Personal Income for Aug (8:30 am), Personal Spending for Aug (8:30 am), Mich. Sentiment -Rev for Sep (9:45 am), Chicago PMI for Sep (10:00 am)
Oct 03: Construction Spending for Aug (10:00 am), ISM Index for Sep (10:00 am), Auto Sales for Sep (12:00 am), Truck Sales for Sep (12:00 am)
Oct 04: Factory Orders for Sep (10:00 am)
Earnings Announcements of Interest
Only stocks with an average daily volume of 500K+ are listed. List may not be complete so be sure to always check your stocks' earnings dates before holding a position overnight. (A) = Earnings after the close, (B) = Earnings before the open, (?) = Earnings time not specified at the time of this writing
Sep. 27: -
Sep 28: KMG (?), RHAT (A), RIMM (A)
Sep 29: FDO (B), PEP (B)
Sep 30: -
Oct 03: CMGI (A), MOS (B)
Oct 04: -
Toni Hansen is President and Co-founder of the Bastiat Group, Inc., and runs the popular Trading From Main Street. She can be reached at Toni@tradingfrommainstreet.com.


 Free Festival of Traders Videos