The Gold Index (^XAU) is revealing a bullish flag formation.
Volume on the SPY proxy yesterday moved ahead of that seen in Monday's sell-off. The 3.8% recovery for the S&P 500 cash index still produced an inside pattern resulting from the large move seen on Monday.
The next three sessions have the potential for a fairly abrupt move as the struggle between those who believe that Thursday November 20 marked a key bottom take on the sceptics that will use any of the really negative data points that are easily found as an excuse to retest that low.
The pattern over recent months has been for traders to get ahead of the employment data so a large move could be seen before the release from the Labor Department on Friday. 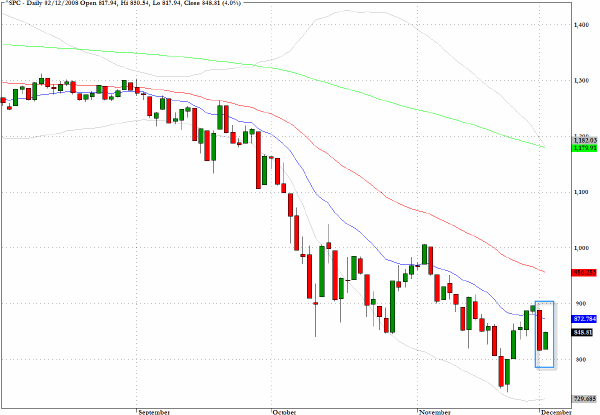
The Euro/USD rate has been quiet and range-bound for several sessions and there is a similar capacity for a rather abrupt move in this cross rate after the decisions from the ECB and B of E as well as the release of Friday's employment data.
While the direction of the next move is far from clear, what can be said in terms of technical targets is that $1.35 level would be a vital test on the upside, it represents the 38% retracement of the recent range, and yet a retest of $1.20 could also be seen as a technical requirement in coming sessions.
For now I am definitely on the sidelines as far as trading the European currencies. 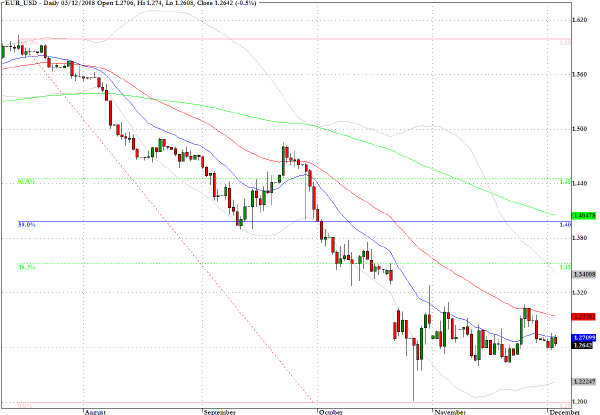
The Gold Index (^XAU) is revealing a bullish flag formation. 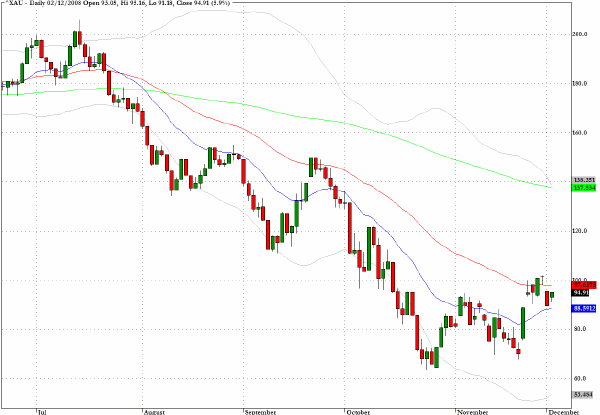
UUP, which represents a bullish viewpoint on the Dollar Index, has reached a level of quite strong overhead resistance and a bearish flag pattern appears to be unfolding. 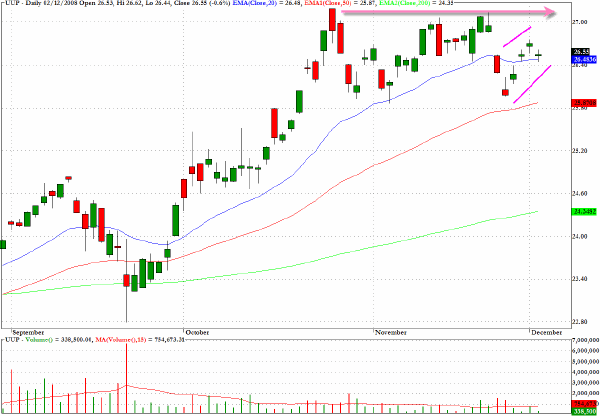
I shall draw attention again to DaVita (DVA) which faces clear overhead resistance from key moving averages and sellers might be looking for temporary strength to provide entry opportunities. 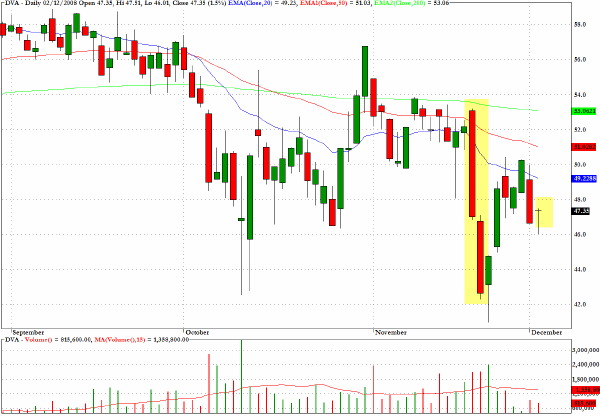
The semiconductor sector fund, SMH, is trading quietly near multi-year lows. There is clearly an absence of buyers and yet the risk/reward prospects are not particularly enticing on the short side either.
Charts like this suggest that a period of low volume trading may lie ahead as we approach the end of the year. 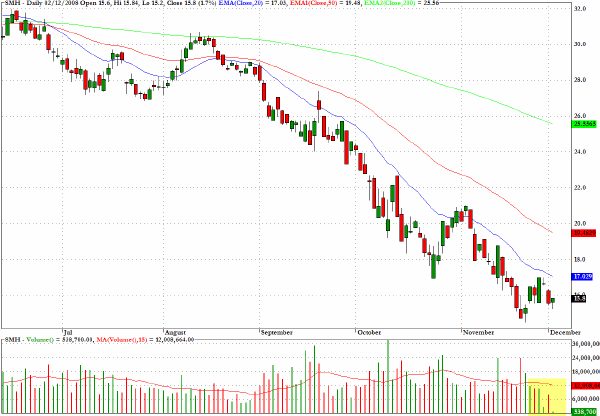
Newmont Mining (NEM) has constructive chart characteristics on the long side. 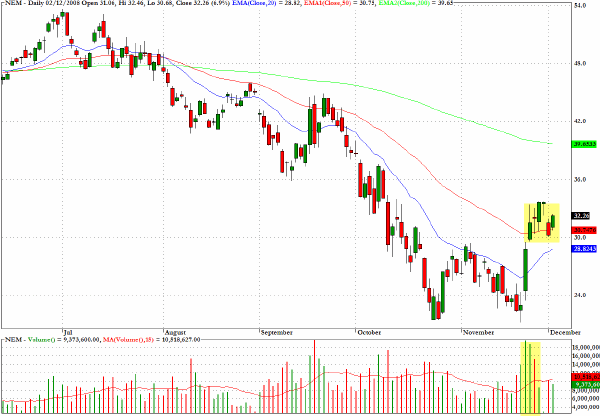
Clive Corcoran is the publisher of TradeWithForm.com, which provides daily analysis and commentary on the US stock market. He specializes in market neutral investing and and is currently working on a book about the benefits of trading with long/short strategies, which is scheduled for publication later this year.
Disclaimer
The purpose of this article is to offer you the chance to review the trading methodology, risk reduction strategies and portfolio construction techniques described at tradewithform.com. There is no guarantee that the trading strategies advocated will be profitable. Moreover, there is a risk that following these strategies will lead to loss of capital. Past results are no guarantee of future results. Trading stocks and CFD's can yield large rewards, but also has large potential risks. Trading with leverage can be especially risky. You should be fully aware of the risks of trading in the capital markets. You are strongly advised not to trade with capital.