| A Mid-Week Look At The Major Indices |
| By Price Headley |
Published
12/3/2008
|
Currency , Futures , Options , Stocks
|
Unrated
|
|
|
|
A Mid-Week Look At The Major Indices
S&P 500 Index
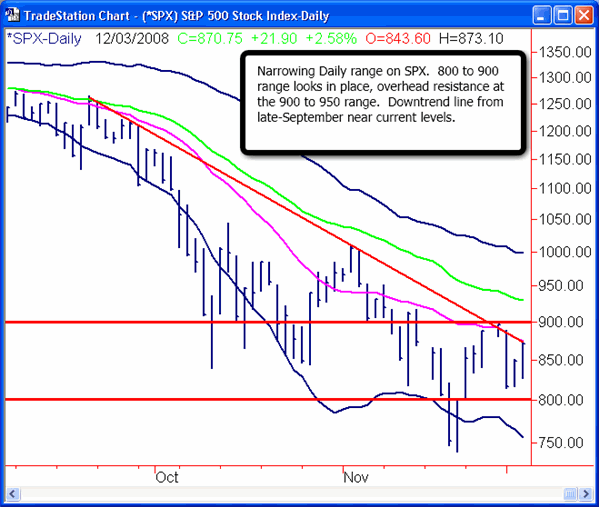
We are showing some short-term strength, but as I mentioned last week, the 900/950 area on the S&P 500 Index remains as overhead resistance, in my view. That is the likely area of a stallout or reversal lower, and 1000 would cap any further upside.
S&P 500 Index Daily Chart

NASDAQ 100 Index
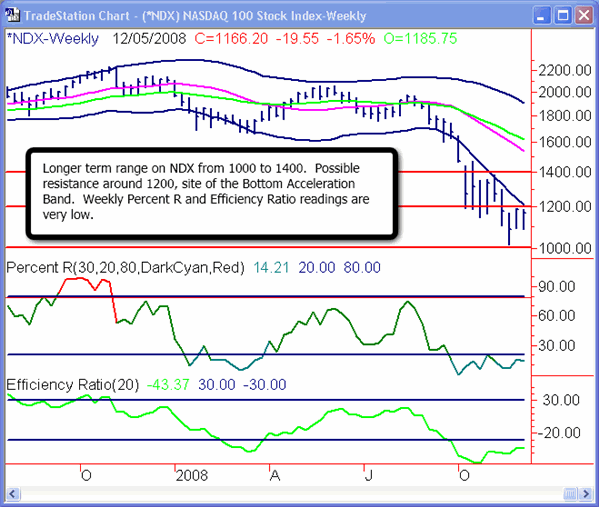
We are approaching the Bottom Acceleration Band around 1200 on the NASDAQ 100 Index (NDX) -- as I mentioned last week, we have been unable to sustain any move above this Band for some time now. As you can see in the following chart, the Weekly Percent R and Efficiency Ratio readings on the NDX remain at extremely low levels.
NASDAQ 100 Index Weekly Chart

Dow Jones Industrial Average
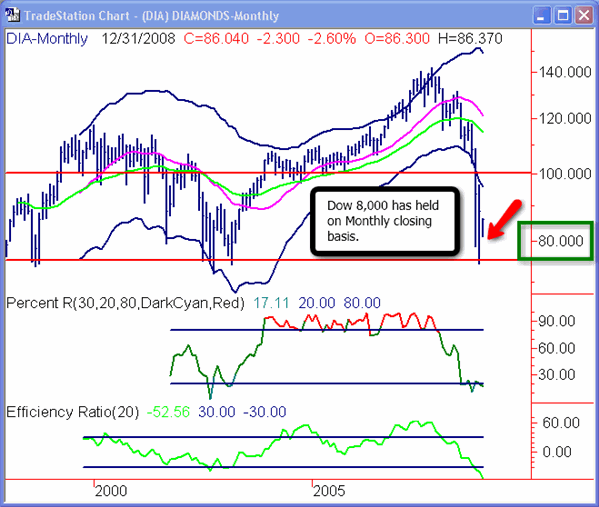
We did hold 8,000 on the DJIA on both the Weekly and Monthly close last week. Breaching that level on either a Weekly or more importantly, a Monthly close, would be significant.
Dow Jones Industrial Average (DIA) Monthly Chart

The Bottom Line
The market is showing some underlying short-term strength, as can be seen by the increasing frequency of strong openings and closings to the trading day. In addition, the "talking head" experts on CNBC are getting noticeably more bullish, in my view (however, that could end up being a bearish signal from a contrarian view). So while there may be some short-term upside, caution is the word of the day, especially as we approach the 900/950 area on the S&P 500 Index, which I view as a likely area to stall out and move lower. There also still remains the smaller possibility that the market could have a strong "dead cat bounce" rally in the coming weeks/months, which would be the precursor to another big leg down, in my view. Bottom line, the odds favor that we will continue the recent wide trading range -- so look to go short near the top of the range (the top of which appears to be downtrending), and long at the bottom of the range.
Price Headley is the founder and chief analyst of BigTrends.com.
|