In the Weekly Outlook in the Stock Market, we pointed at that the major indexes were trying to set up a bullish move, but really hadn't been challenged yet. We anticipated such a challenge occurring at the 10 and/or 20 day moving averages, and that's exactly what we got on Monday -- like clockwork. In fact, the precision is almost uncanny. So today, we'd like to spend at least a little time looking at how the bears won the first battle at the short-term averages. We'll also look at how the bulls could strike back big.
Dow Jones Industrial Average
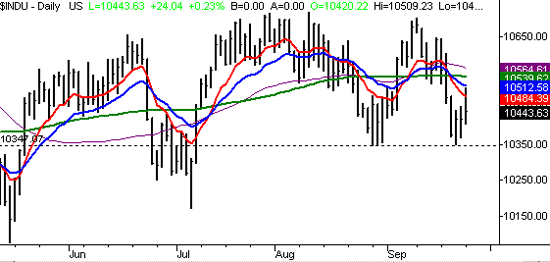
Let's just start with the Dow. The 10 day average was at 10,484, and the 20 day line was at 10,512. The high from yesterday was 10,509.....basically matching the 20 day average. So the Dow made a strong attempt, but closed rather weak by ending in the lower half of today's trading range. Still, the Dow is coming up off of the line at 10,350 for the second time in a month, so we have to give the bulls the benefit of the doubt for the time being. In the case of the Dow, we'd like to see a close above all of these lines before getting too excited. The upper moving average line is the 50 day line, at 10,564.
Dow Jones Industrial Average - Daily
S&P 500
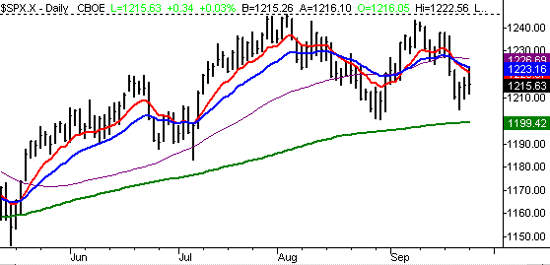
For the SPX, the story is about the same. The 20 day line was at 1223, and the high from Monday was 1222. For the record, the 10 day line was at 1221. And like the Dow, the close wasn't overly impressive, yet we have to acknowledge that a gain of any size is still a gain.
S&P 500 - Daily
NASDAQ Composite
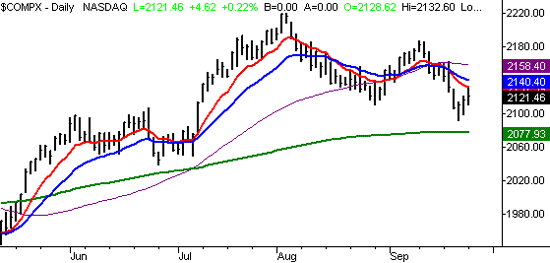
The NASDAQ didn't even make it up to the 20 day moving average line at 2140. Instead, the 10 day line at 2132 capped the NASDAQ, limiting it to a high of 2132.6. While the NASDAQ made the least headway into the resistance of its moving averages, the composite actually had the most impressive close. By that, we mean that the NASDAQ was the only index to close above Friday's high. So again, despite the resistance we're seeing, we have to say that the chart looks more bullish than bearish.
NASDAQ Composite - Daily
So really, not a lot has changed since our look on Saturday. The retest thus far hasn't been unusual, nor has it been unbullish. We should see some hesitation around these key averages, as a little skepticism is healthy.....it's the unquestioned rallies that end up creating huge selloffs. Keep an eye on the 10 and 20 day lines this week; they'll be a major factor in predicting the next move.
Price Headley is the founder and chief analyst of BigTrends.com.