| Corcoran Technical Trading Patterns For December 5 |
| By Clive Corcoran |
Published
12/5/2008
|
Stocks
|
Unrated
|
|
|
|
Corcoran Technical Trading Patterns For December 5
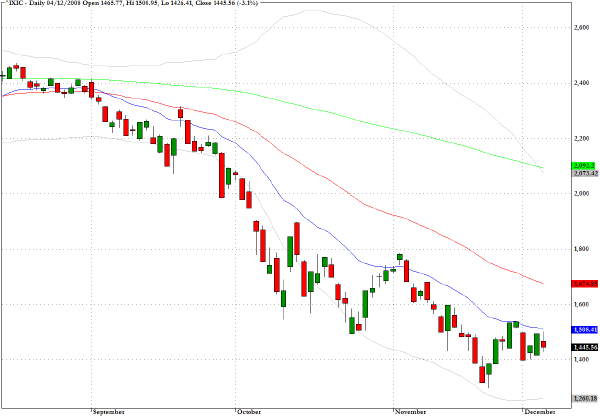
The chart for the Nasdaq Composite Index (^IXIC) has been moving sideways albeit within a larger structural downtrend. While certain charts are suggesting that a large move could be shaping up, and perhaps even triggered by today's employment data, it is also not inconceivable that this broadening basing pattern could not extend into next year.
Analysts and traders may decide that, even if the unemployment data is as bad as feared, there may be no need to express a decisive directional bias at present.
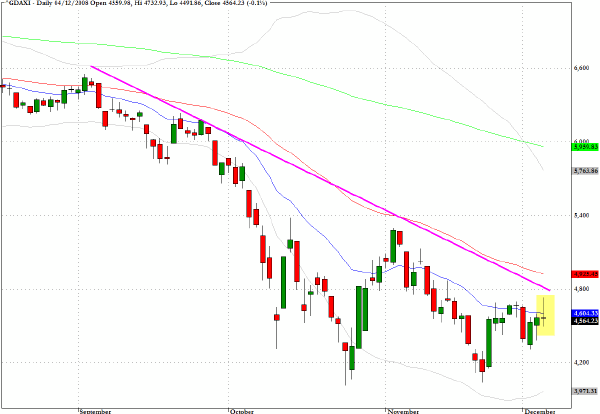
The decision by the European Central Bank to reduce the short-term rate in the Eurozone by 75 basis points was its largest rate move in its more than ten-year history. It is remarkable now to think that Mr. Trichet was actually raising rates as recently as August but now there is mounting evidence that the EU's economy is deteriorating rapidly.
Yesterday's doji star formation on the DAX chart shows that the German index faces a real hurdle in breaking above the trendline through the highs despite the fact that a basing pattern has not been violated since mid-October.
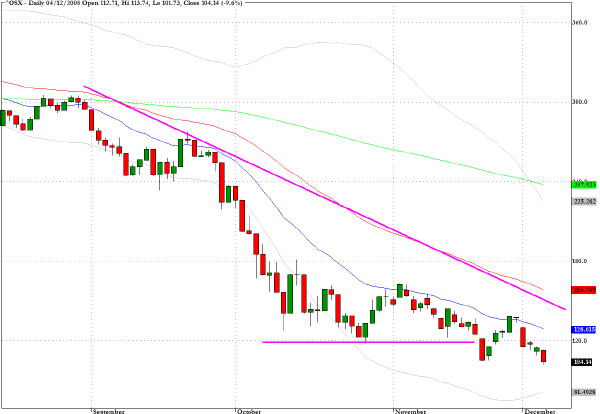
The Oil Services Index (^OSX) has broken below the baseline of the descending wedge for a second time and a recovery will face stiff resistance at the 120 level.
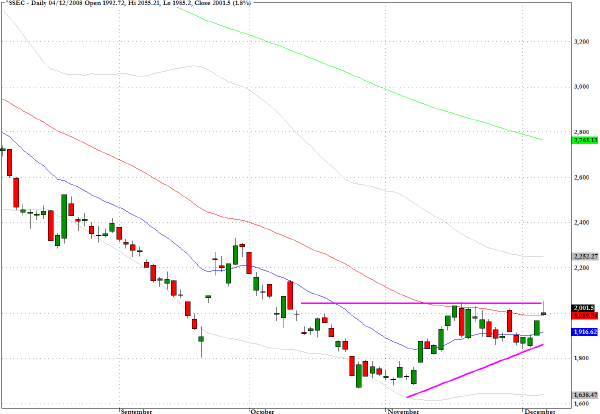
The Shanghai Exchange index (^SSEC) has a broadening base with evidence that it could be ready to move beyond the ascending wedge frame which has been evolving.
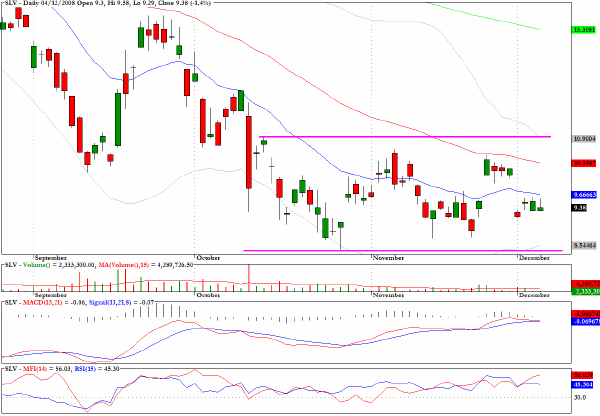
At the request of one reader of this column I'll look at the chart for an exchange traded fund that gives exposure to silver, SLV.
Clearly revealed is sideways channel which has been in effect for a couple of months. There is a clear layer of overhead resistance to be overcome and the most encouraging sign for a bullish view is the MFI chart which suggests some accumulation. On the whole though I would not be anxious to take a firm view on this at the moment.
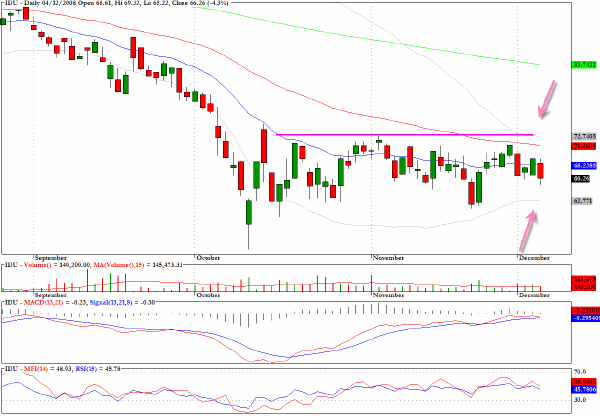
IDU, which tracks the Dow Jones Utilities Index, shows the constriction of the volatility (Bollinger) bands which are also manifest on many charts at present suggesting that a strong directional move lies ahead. There is evidence of a basing pattern just below the 50-day EMA and a break above this level could gain momentum in the near term.
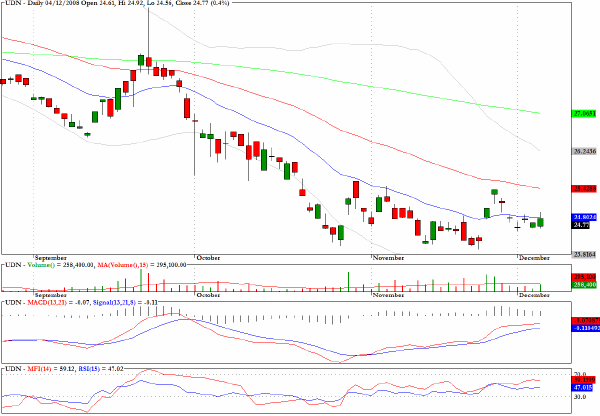
The bearish version of the Dollar index fund is revealing a basing pattern.
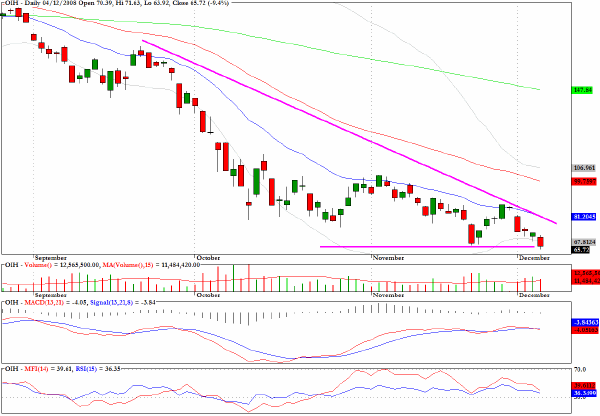
The exchange traded fund for oil services OIH is now below the baseline of a declining wedge pattern.
Clive Corcoran is the publisher of TradeWithForm.com, which provides daily analysis and commentary on the US stock market. He specializes in market neutral investing and and is currently working on a book about the benefits of trading with long/short strategies, which is scheduled for publication later this year.
Disclaimer
The purpose of this article is to offer you the chance to review the trading methodology, risk reduction strategies and portfolio construction techniques described at tradewithform.com. There is no guarantee that the trading strategies advocated will be profitable. Moreover, there is a risk that following these strategies will lead to loss of capital. Past results are no guarantee of future results. Trading stocks and CFD's can yield large rewards, but also has large potential risks. Trading with leverage can be especially risky. You should be fully aware of the risks of trading in the capital markets. You are strongly advised not to trade with capital.
|