| The McMillan Options Strategist Weekly |
| By Lawrence G. McMillan |
Published
12/5/2008
|
Options
|
Unrated
|
|
|
|
The McMillan Options Strategist Weekly
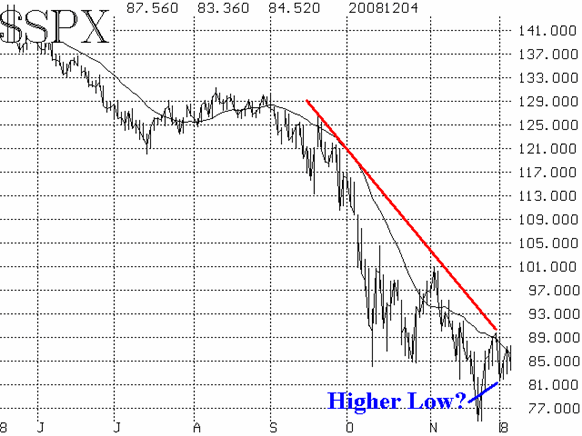
Despite quite a bit of intraday volatility and some jockeying back and forth among our technical indicators, one factor remains constant: the $SPX chart is still bearish. Until proven otherwise, we will not turn bullish on this market. The trend lines are downward-sloping as is the 20-day moving average. All is not lost, however, as there is a chance that a buy signal is building.
The late November rally ended abruptly, with Monday's huge decline. However, the decline this week has, so far, bottomed out around the $SPX 815 level. If that holds and the market moves higher, a "higher low" will be in place. Then, sights would be set on the $SPX 896 high of last week. If that were exceeded, then a "higher high" would exist as well. The combination of "higher high" and "higher low" would be an intermediate-term buy signal. Admittedly, this scenario will take some work, but it is still possible at this time. Note, from Figure 1, that a breakout above 896, would also be a break of the current downtrend line (red line on chart).

That would be the most bullish scenario, but it's certainly not the only one that can evolve. In fact, the path of least resistance might merely be a continuation of the downward trend. A break below Monday's lows at 815 would reconfirm the bearish case, and would likely issue in a full retest of the November lows.
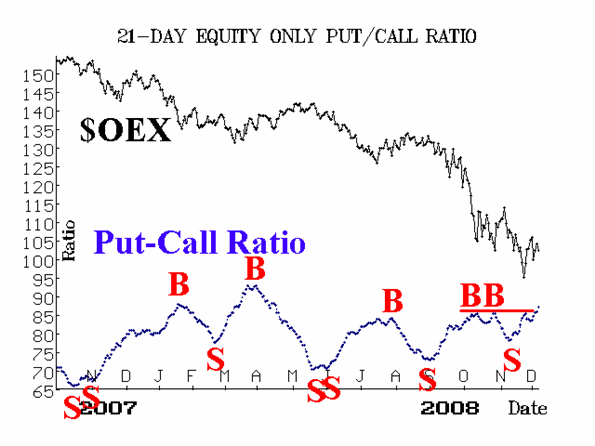
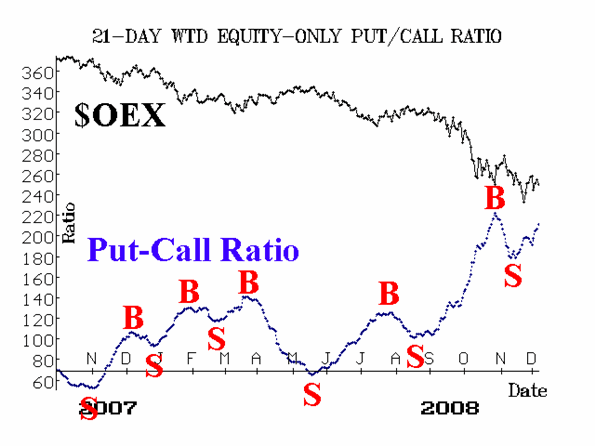
Despite the late-November rally and the potential bullish setup that is evolving, not all of the other indicators are in line. The most glaring disparity occurs in the equity-only put-call ratios. Recent activity has pushed these ratios clearly upward, reaffirming sell signals. It should be noted that they are very high on their charts, and thus "oversold." Hence, it wouldn't take a lot to roll them over to buy signals. But at this time, they are bearish. In fact, the standard ratio is making new highs for this leg of the bear market.

Market breadth has recovered from the historic, deeply oversold readings of late November. The month-end rally completely worked off that oversold condition, resulting in buy signals from breadth.

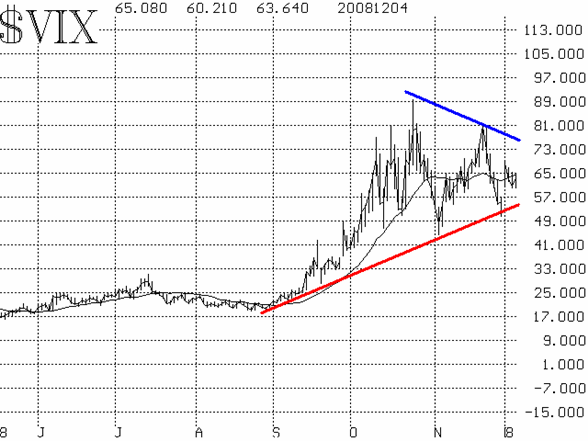
Volatility indices have remained surprisingly elevated, even though the market has seemingly taken on something of a more positive tone since the late-November lows. As a result, the longer- term uptrend in $VIX remains in place -- and that means $VIX is still on a sell signal.

In summary, despite the exhortations of the media and the typically bullish analysts, this market remains in a bearish downtrend. That would change in the near future only if $SPX can close above 896.
Lawrence G. McMillan is the author of two best selling books on options, including Options as a Strategic Investment, recognized as essential resources for any serious option trader's library.
|