| Outlook On The Stock Indices |
| By Price Headley |
Published
12/7/2008
|
Currency , Futures , Options , Stocks
|
Unrated
|
|
|
|
Outlook On The Stock Indices
NASDAQ Composite
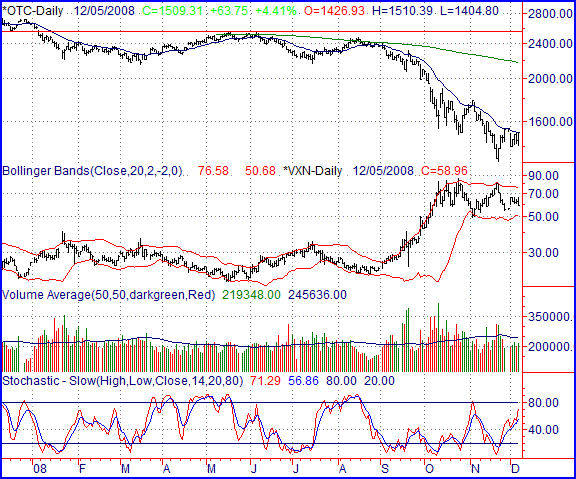
The closing level of 1509.31 for the NASDAQ on Friday was the result of a 63.75 point/+4.41% rally. That left the composite just 27.26 points below (-1.77%) the previous Friday's close.
The pace of the overall downtrend is slowing, though that's actually the only thing of any substance the bulls have managed to accomplish so far. We make that statement in light of the 20-day moving average line, which the composite has managed to challenge several times (including Friday), but has yet to actually make its way above. It's at 1509 right now, which is within striking distance.
Even if the composite does manage to crack that ceiling, we'd be leery of any great deal of upside unless the VXN can make its way to new multi-week lows of its own. It looks like the 50 level is the VXN's line in the sand. Not only was that the low from early November, but it's also where the lower Bollinger band (20-day) is resting now. Considering how much of a factor the VXN's 20-day Bollinger band has been lately - bearish and bullish - that's an area well worth watching. In fact, it may be more telling than the NASDAQ's chart is.
NASDAQ Composite Chart - Daily

S&P 500
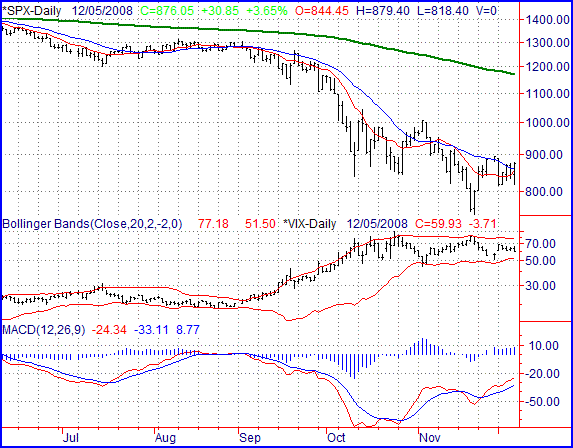
The S&P 500 rallied % on Friday (+ 30.85 points) to end the session at 876.05. For the week though, the large cap index still finished in the hole. That close of 876.05 was still 20.20 points (-2.25%) below the prior week's close.
Just to play the devils; advocate a little bit, we'll take on a slightly more bullish tone for the S&P 500 than we did with the NASDAQ or than we will for the Dow. After all, the market can't keep falling forever, and now's as good of a time as any for a recovery.
The SPX managed to get back above its 10- and 20-day averages as of the end of last week. That's bullish. However, we've seen it before (on October), and it didn't mean anything other than an immediate move to even lower lows. So, we're not going to jump the gun and get too excited.
The bullish argument is also bolstered by the MACD plot. It also reveals that the current momentum is shifting to the upside.
The key to any bullish longevity will be a successful test of that bullishness. It's easy to be a bull when stocks are rising; how will those same buyers respond when the market is really challenged? Of course, Friday's intra-day selloff - a big one - certainly could be considered a test of sorts (and it was). However, we'd like to see a complete cross of the 20-day line, then a pullback, and then see support made there. That would go far in convincing more buyers that it's safe to get back in the water.
The 'safe' mentality will be evidence by better bullish volume that what we're seeing now.
Like we said though, the market can't keep falling forever. If the VIX presses into that lower Bollinger band a few consecutive times, you may be surprised how rapidly the market can make gains. We'd just rather see it happen after a decent retest.
S&P 500 Chart - Daily

Dow Jones Industrial Average
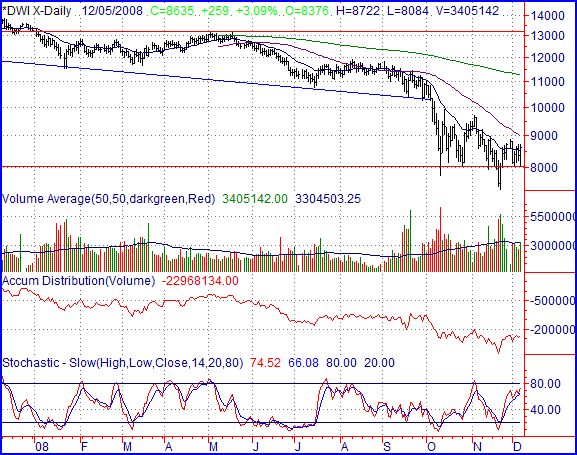
The Dow's 3.09%/259 point gain on Friday left the blue chip index at 8635 on Friday. That pulled the Dow to within 194 points of the prior week's close ... 2.2% below it.
The most interesting aspect to the Dow's chart, however, isn't the gain or loss for the week. It's how 8000 has been revealed as a key support level. That's about where we hit lows in late October, and effectively where we hit lows in early October (the brief dip under 8000 in early October was immediately undone with a big bounce). We sank as low as 7392 in mid-November, but with the exception of that dip, November's lows were also all around 8000. Now to see it shape up again in December? That's not something to overlook.
Yes, Friday was compelling, but frankly, doesn't prove a lot. The Dow barely made it back above the 20-day moving average line (blue), and even when it has done so recently, it hasn't led to any great recovery. To really be impressed, we'd like to see it hurdle the 50- day average line (purple) at 9033. That would be a multi-month first.
Though volume has been better for the bulls, it still wouldn't qualify as 'strong'. Once bullish volume is combined with bullish momentum, the big barriers will be knocked out of the way. Until then, we still have our doubts about this upswing's longevity.
Dow Jones Industrial Average Chart - Daily

Price Headley is the founder and chief analyst of BigTrends.com.
|