| The Stock Market And Logic |
| By Price Headley |
Published
12/8/2008
|
Currency , Futures , Options , Stocks
|
Unrated
|
|
|
|
The Stock Market And Logic
There is a reason why we focus on technical analysis rather than fundamental analysis. While corporate balance sheets and press releases might be deceiving, the stock charts don't lie. Nothing could be truer in our current market environment.
Last Friday, we received a jobs number that was staggering; a loss of 533,000 jobs in November compared to the expected 350,000 job loss numbers. These job cuts lead to an increase of the US unemployment rate to 6.7%, the highest this metric has been since 1993.
We also received word last week that AT&T, Honda Motors, DuPont, and Credit Suisse were beginning major corporate layoffs to cut expenses during this recession. Today we add that 3M and Dow Chemical are cutting huge chunks of their respective workforces to remain profitable in the future. Take a moment to digest the magnitude of how bad the economy is now. Okay, that's over.
But the questions remain: How is this market able to rally when the bad news never ceases? Everyone in the civilized world has conceded that things are likely to get worse before they get better, right?
The answer is that people are trading on emotion (fear and greed), and these emotions are at such extreme levels that wild swings in the market have become the norm. When the CBOE Volatility Index (VIX) remains around 60 (25 is about the norm), traders should expect the unexpected. Hedging and balance in your portfolio becomes critical to your long term viability.
Take DryShips Inc. (DRYS) for example. Traders loved DRYS last February when it was trading at $84.25 and had a P/E (Price to Earnings ratio) of 18.7. They loved it even more in October of this year when it was trading at $73.40 and had a P/E of 20.3, an 8.5% increase in 8 months.
In November, as it was painfully obvious that the markets were in free fall and the US was in a deep recession the stock traded at $21.94, down over 70% year-to-date, and having a P/E of 5.2.
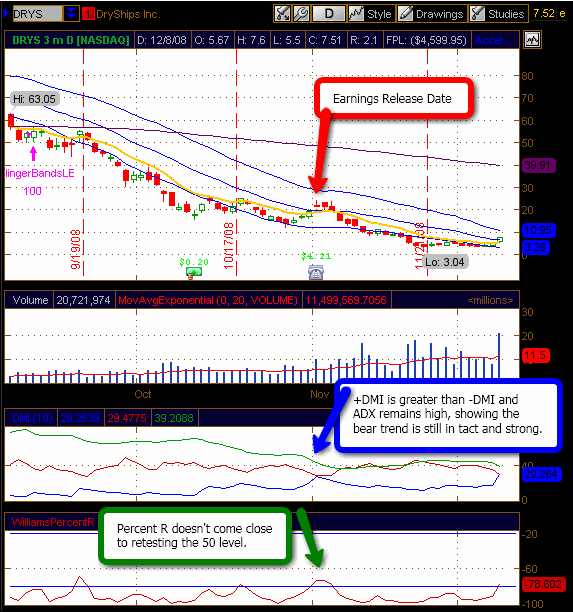
If you were trading this stock based upon valuation as some fundamental traders do, then you would've bought this stock thinking it was cheap. The chart below shows that DRYS was an obvious sell based on the technicals in November.

On November 21, DRYS hit a 52-week low of 3.04, and now trades in the mid $7 range.
In this market, fundamentals don't work, so we need to read the charts to determine what and how to trade.
Price Headley is the founder and chief analyst of BigTrends.com.
|