| Corcoran Technical Trading Patterns For December 10 |
| By Clive Corcoran |
Published
12/10/2008
|
Stocks
|
Unrated
|
|
|
|
Corcoran Technical Trading Patterns For December 10
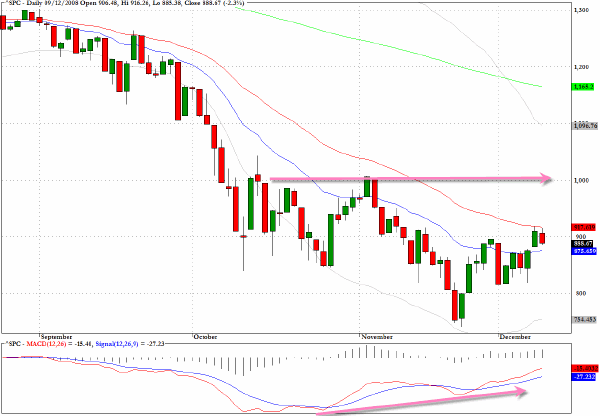
The S&P 500 (^SPX) chart reveals classical positive momentum divergences as the multi-year lows attained on November 20 and 21 were not confirmed by the orientation of the MACD indicator. In fact, there is a notable upward slant to the momentum characteristics during the latter half of November. We have been witnessing during the recent recovery a common manifestation of the results of this kind of market dissonance, although the recent price action and money flow is not as overwhelmingly positive as the degree of divergences might have suggested.
I still maintain that intermediate term targets on the upside are most feasible at the 1000 level although there are layers of overhead supply in between.
The more that any rally continuation resembles a "V" shape the more likely we will see another sharp sell-off. The bullish case would be best served if the recovery slope were more gentle.
There is mounting evidence to suggest that the business model for financial services firms, in particular the broker/dealers and money center banks, has been undergoing a massive transformation in recent months and according to some commentators and analysts is now "broken".
Alan "Ace" Greenberg, formerly chairman of AIG, has been quoted in a news article as follows:
``There's no more Wall Street,'' Greenberg, said in an interview on Bloomberg's Money & Politics television program. ``That model just doesn't work because it's at the mercy of rumors.''
Recent comments from PIMCO's Bill Gross take matters from a less emotionally charged perspective but essentially reached a somewhat similar, if less dramatic, conclusion.
The changed circumstances for the financial sector pointed to by Bill Gross are more specific in that he claims that the days of high leverage, complex securitizations, light touch regulation from governments and lax credit rating standards are as he puts it "in our past and not in our future."
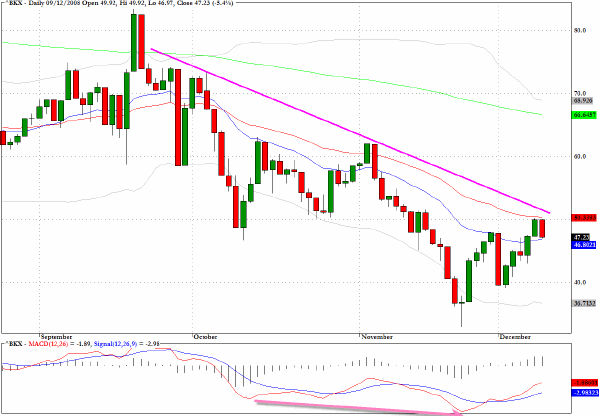
It is interesting to see that there is, from a technical analysis perspective of prospects for the sector, an echo in the chart patterns of XLF and the KBW Banking Index (^BKX) of the concerns expressed by both of these astute market commentators who are coming at the sector's future more from a high level, business "fundamentals" perspective.
While there may be more upside to come for the overall market, as reflected in the significant positive divergences for the S&P 500 chart, there is evidence on the BKX chart that overhead resistance is more formidable and that the same resolution of underlying market dissonance should not be expected.
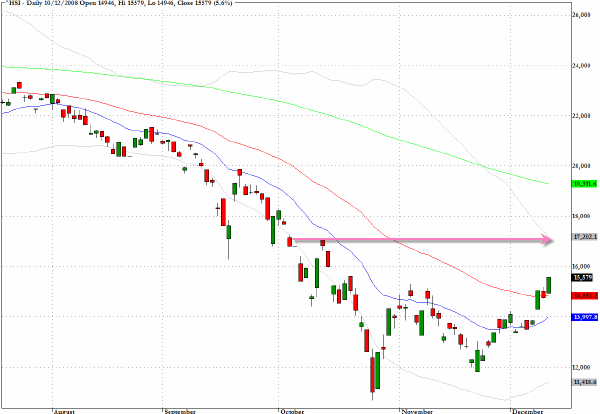
I drew attention in Monday's column to the fact that the Hong Kong market is showing some of the most positive signs among global equity markets at present. The Hang Seng Index (^HSI) resumed its climb above its 50-day EMA in Asian trading on Wednesday with a rather impressive 5.6% gain.
Targets for the intermediate term are 17300 where there is chart resistance and perhaps longer term this index will be looking at the 18800 area which would be a 38% retracement of last year's high around 32000 and this year's low just below 11000.
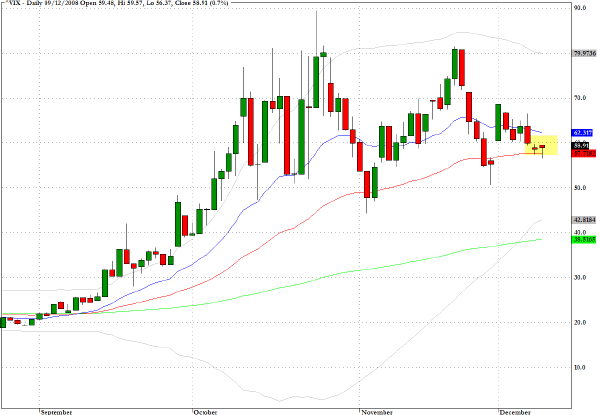
Yesterday's retreat in the US market failed to inject much drama during the session and the CBOE Volatility Index (VIX) registered a confined move. If the index can now sustain closes below the 50-day EMA this would reinforce the notion that risk aversion among asset allocators is diminishing.
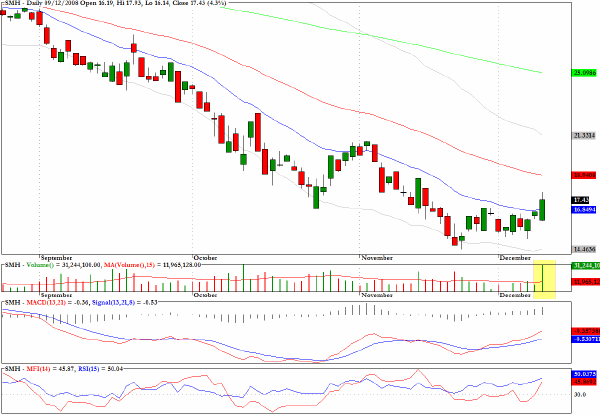
The exchange traded fund for some of the large semiconductor stocks, SMH, produced a substantial increase in volume on a more than 4% gain for a session in which the market as a whole declined.
A downward trendline through recent highs needs to be successfully challenged but one can contemplate a move up to the 50-day EMA around $19 for this fund.
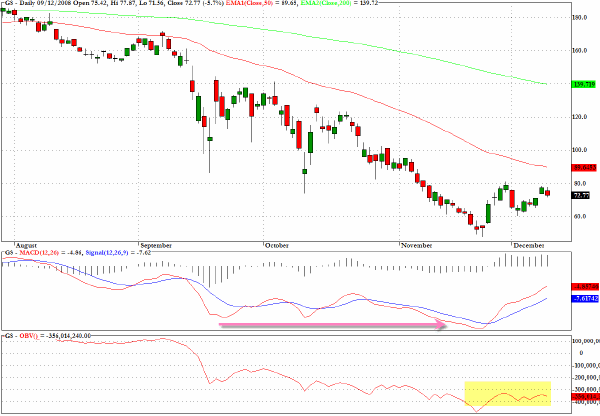
In accordance with my comments about the absence of positive divergences among the financials and banking sector, Goldman Sachs (GS) is not displaying the kind of dissonance that is seen in several sectors and that needs to be worked off via a vigorous rally.
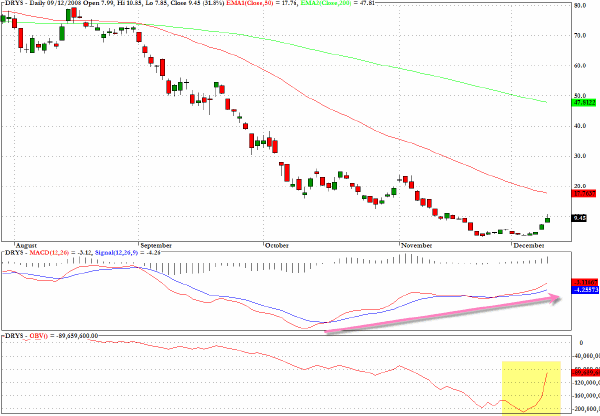
The chart for Dryships (DRYS) reveals just the opposite dynamics to that seen for Goldman Sachs and shows just how dramatic a recovery in the shipping sector could be. This is not a stock for widows and oprhans or the faint hearted in general.
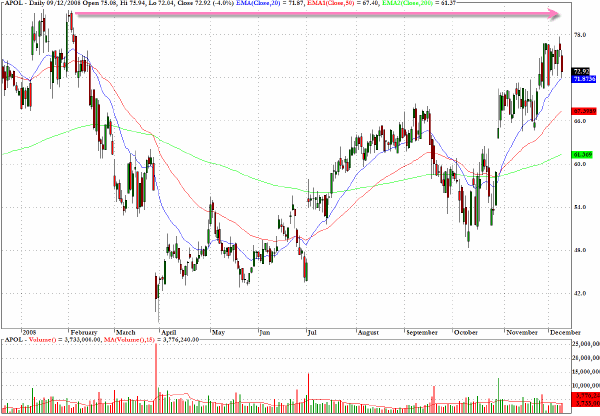
One of the more reliable patterns on the long side that my scanning technology has uncovered is expressed in the chart for Apollo (APOL) and I would favor a re-test of the recent highs.
Clive Corcoran is the publisher of TradeWithForm.com, which provides daily analysis and commentary on the US stock market. He specializes in market neutral investing and and is currently working on a book about the benefits of trading with long/short strategies, which is scheduled for publication later this year.
Disclaimer
The purpose of this article is to offer you the chance to review the trading methodology, risk reduction strategies and portfolio construction techniques described at tradewithform.com. There is no guarantee that the trading strategies advocated will be profitable. Moreover, there is a risk that following these strategies will lead to loss of capital. Past results are no guarantee of future results. Trading stocks and CFD's can yield large rewards, but also has large potential risks. Trading with leverage can be especially risky. You should be fully aware of the risks of trading in the capital markets. You are strongly advised not to trade with capital.
|