| A Little More Patience For The Bulls |
| By Price Headley |
Published
12/10/2008
|
Currency , Futures , Options , Stocks
|
Unrated
|
|
|
|
A Little More Patience For The Bulls
Over the last few weeks, I've planted a few seeds regarding the market. Specifically, I looked at the potential revival of the credit market, a market dynamic that screams capitulation then reversal, and an indicator that tells us when enough is enough for stocks. I haven't had much of a chance to revisit those seeds since then, so I'm going to devote some time today to update each of these ideas - there have been some interesting changes in the meantime.
When is a Credit Market Unthawed?
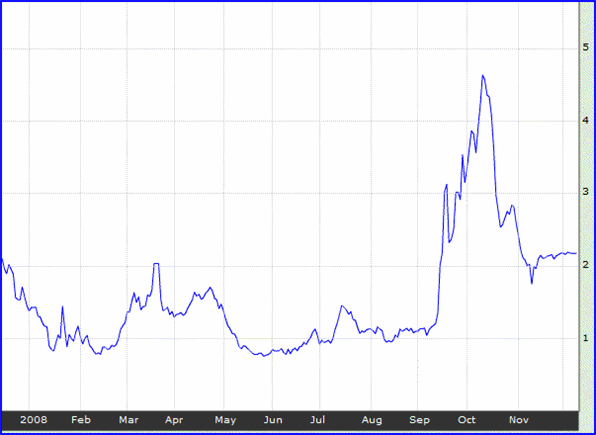
Back on October 22, we posted our first chart of the TED Spread, which indicates how much fear banks see in lending based on how much they charge each other for intra-bank borrowing. Of course, like any consumer, the higher the interest rate, the less attractive it is to borrow, so unattractive to borrow, that they don't. The spread surged in September when lending basically ceased, but how has the chart shaped up since then? Take a look.
TED Spread (we thank Bloomberg.com for the chart)

In a nutshell, the TED spread has stalled just above 2.0. That's not bad, as we've seen moderate lending activity under a higher TED spread. However, something closer to 1.0 would make me feel a lot better.
Patience Bulls, Almost There
On November 12, I suggested that the market was not only well oversold, but that breadth and depth had been pushed to bearish levels that were unsustainable. Theoretically, that's bullish. The combination of breadth and depth can be quantified in the Arms Index, or TRIN, which is the tool we highlighted to suggest the idea in the first place.
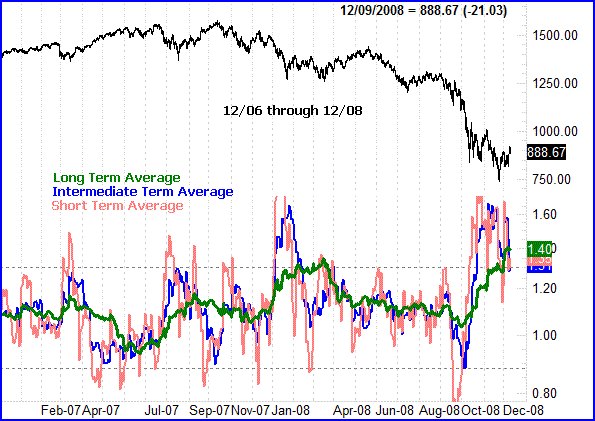
With the write-up from the 12, I laid out three charts to show you three moving averages of the NYSE's TRIN data -- a short-term, intermediate-term, and long-term view. The actual Arms Index data is way too erratic to use, so we smooth it with moving averages. To be more efficient today, I'm going to put all three moving averages on the same chart.
At the time I wasn't fully bullish, as being oversold is one thing -- rallying out of an oversold situation is another. However, the conditions were certainly right for a rebound. Since then, the short- and intermediate-term lines have lingered at very high levels, while the long-term line has made its way to the same levels. Point being, we're very ripe for a rebound. Nothing has really changed with my outlook, though we are closer to any would-be rally.
Though most of the media is determined to be pessimistic, I'm not going to jump on the bandwagon. Yes, stocks aren't worth much right now, but we have to get over our assumption that stocks trade at what they're worth. I'll take a rising stock of a bad company before I buy a falling stock of a good company. If the market's rising, it's rising, which the TRIN data suggests we're oh-so-ready to do.
NYSE Arms Index Moving Averages, 12/06 through 12/08

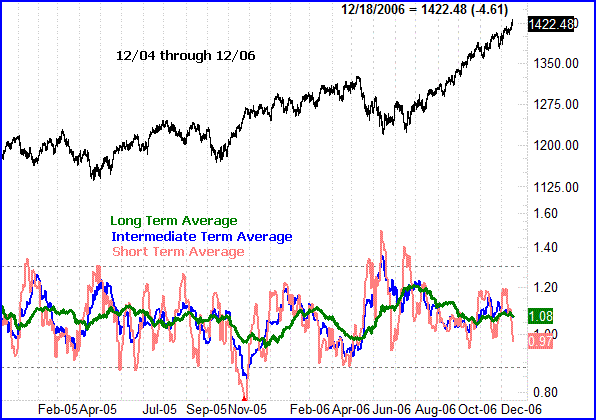
Just for the record, I wanted to give you a little history of how well the ARMS Index can work. So, I'm also adding the same chart above, just rolled back to a prior timeframe.
NYSE Arms Index Moving Averages, 12/04 through 12/06

My Long-Awaited 90/10 Day
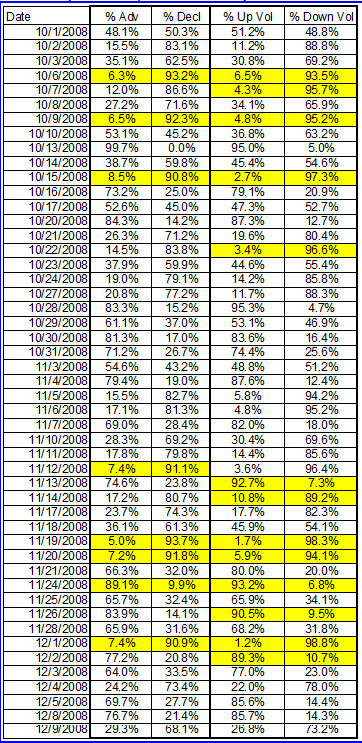
On October 29, I laid out my theory (well, not my theory, someone else's theory that I adopted) that the market really wouldn't begin to recover until/unless we saw a 90/10 day. What's a 90/10 day? It's a day where 90% of the volume is bullish, and 90% of stocks are going higher (which would really seem like a 90/90 day in my head, but whatever). The idea is that only institutions have that kind of power, and if they're starting to get back in, you want to follow their lead. On that same day, I also begrudgingly acknowledged that I'd accept a few 80/20 days in lieu of a 90/10 day.
And how has the NYSE fared since then? Take a look at the table below. Just for fun, I highlighted all the 90/10 day as well as the 10/90 days, which are bearish, obviously. It's amazing how volatile the market has been. More importantly though, we have seen a few partial 90/10 days, and one almost 90/10 day for both criteria -- the Monday before Thanksgiving. It'll be interesting to see if the transition to predominantly bullish breadth and depth really is ushering in bullishness. So far, the jury is still out.
Advancers/Decliners, Bullish Volume/Bearish Volume

Price Headley is the founder and chief analyst of BigTrends.com.
|
|