| Corcoran Technical Trading Patterns For December 11 |
| By Clive Corcoran |
Published
12/11/2008
|
Stocks
|
Unrated
|
|
|
|
Corcoran Technical Trading Patterns For December 11
In last Friday's column, ahead of the employment data, I suggested that although there is evidence of a basing pattern there might be a tendency for traders to postpone large directional decisions and that we might drift sideways for a while on the equity indices.
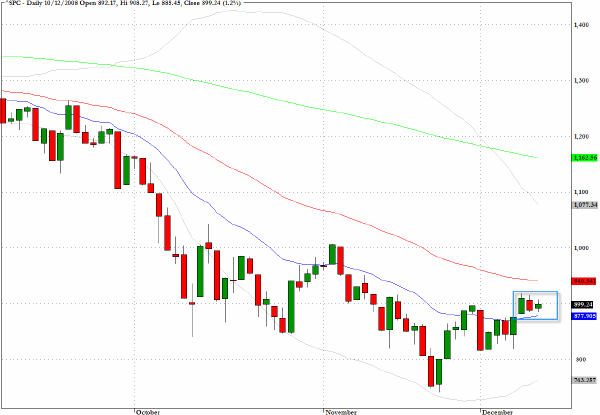
Despite the sharp and surprising rally last Friday, the last two sessions for the S&P 500 (^SPX) have been inside days which is an unusual occurrence and shows that all of the price action on Tuesday and Wednesday took place within the range explored in Monday's session.
The co-occurrence of consecutive inside days and an NR7 session is often a precursor to a larger move and perhaps we could well be heading for a major breakaway move over the next couple of sessions.
It would be tempting to think that this would be a decisive challenge to break above the 50-day EMA but unless this is accompanied by a substantial pickup in volume one should be wary of assuming that this truly is a sustainable bullish breakout.
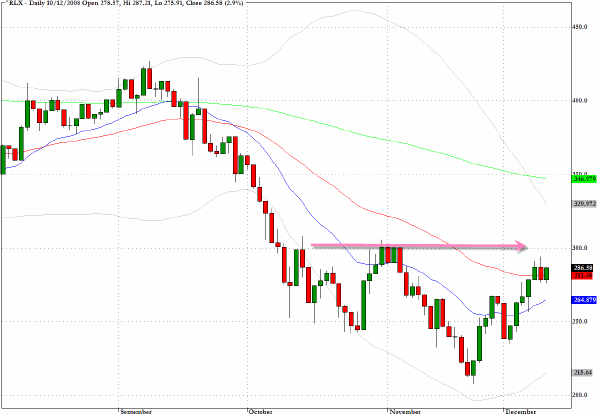
The S&P Retail Index (^RLX) seems to be targeting the strong overhead resistance level marked on the chart below.
Key retail sales data to be released tomorrow morning could perhaps provide a catalyst for a significant price rejection at the 300 level or a cue to the overall market that stories regarding the death of the US consumer have been somewhat exaggerated.
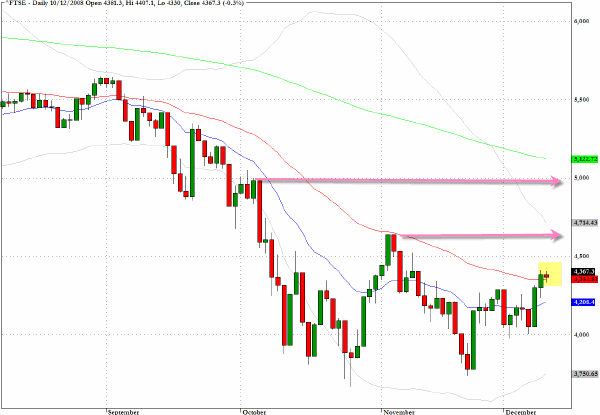
The economic news in the UK seems to get more dire everyday and there are some well founded concerns that there could be a sterling crisis. In modern economic history the UK has had episodes in which sterling has had to be effectively devalued against the dollar but now the new threat is from the loss of purchasing power with respect to imports from the Eurozone which is by far the UK's leading trading partner.
The FTSE faces several difficult hurdles - initially the 50-day EMA, then an area of chart resistance around 4650, and most formidably at the 5000 level.
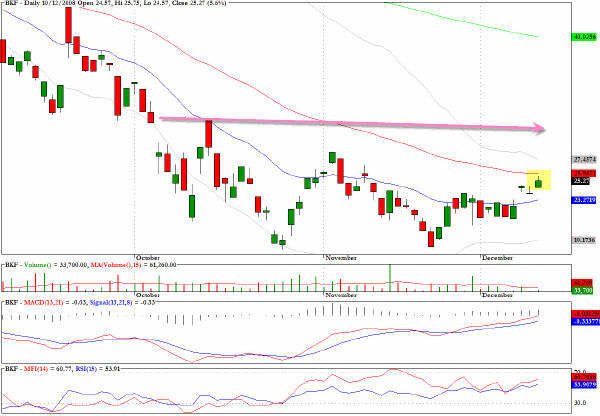
The sector fund BKF which tracks the MSCI BRIC index has to get above the 50-day EMA and then face strong resistance at the level indicated which was the reaction high achieved on October 14.
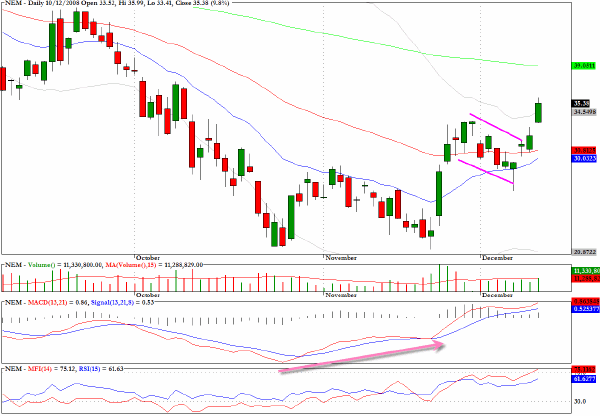
Newmont Mining (NEM) gapped up on the open yesterday and delivered an almost ten percent return. Spot gold is behaving somewhat erratically with gap up and down moves and apart from positive technical divergence on the chart for the mining stock, there is also the supporting factor that the ratio between the metal itself and the mining stocks is significantly below its historical average.
The Euro looks set to break from the triangular formation that I discussed in Monday's column and the $1.35 target is on the radar screen. There are numerous counter currents in the cross rate complex with the British pound at historically low levels against the euro.
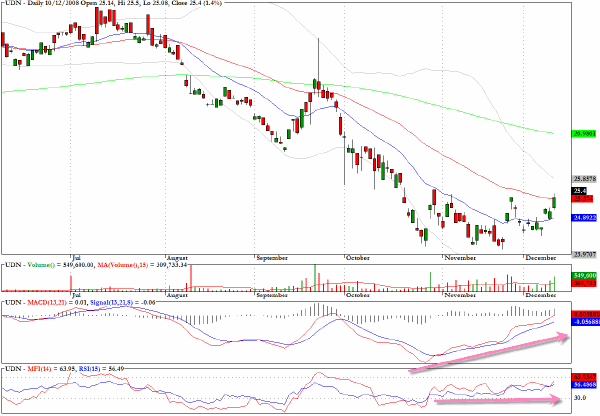
Overall I still favor lower values for the dollar index and this can be played via the inverse sector fund UDN. Although the MACD chart is very supportive there is not a notable degree of accummulation and positive money flow, and this suggests that a major upward thrust (i.e. a major down move for the dollar) is not in the offing.
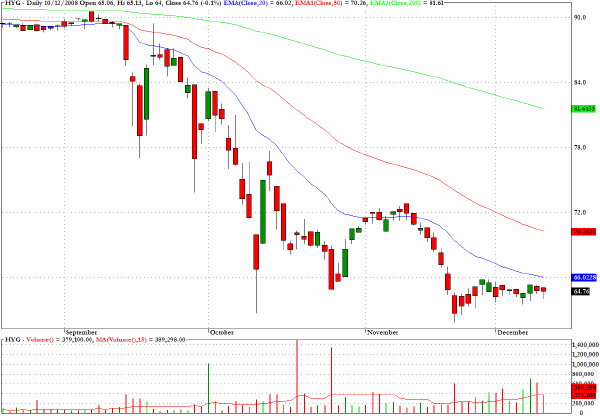
HYG, an ETF which tracks the high yield corporate bond market is showing no signs of recovery and it is harder to make the case that we are witnessing a basing pattern. More plausible is the scenario that we are seeing further retrenchment in the apex of a large descending wedge pattern.
Clive Corcoran is the publisher of TradeWithForm.com, which provides daily analysis and commentary on the US stock market. He specializes in market neutral investing and and is currently working on a book about the benefits of trading with long/short strategies, which is scheduled for publication later this year.
Disclaimer
The purpose of this article is to offer you the chance to review the trading methodology, risk reduction strategies and portfolio construction techniques described at tradewithform.com. There is no guarantee that the trading strategies advocated will be profitable. Moreover, there is a risk that following these strategies will lead to loss of capital. Past results are no guarantee of future results. Trading stocks and CFD's can yield large rewards, but also has large potential risks. Trading with leverage can be especially risky. You should be fully aware of the risks of trading in the capital markets. You are strongly advised not to trade with capital.
|