| Volatility On The VIX Is Decreasing |
| By Price Headley |
Published
12/11/2008
|
Currency , Futures , Options , Stocks
|
Unrated
|
|
|
|
Volatility On The VIX Is Decreasing
The CBOE Volatility Index (VIX) measures the implied volatility of S&P 500 Index (SPX) options. However, the VIX itself has options traded on it, and those VIX options have their own implied volatility.
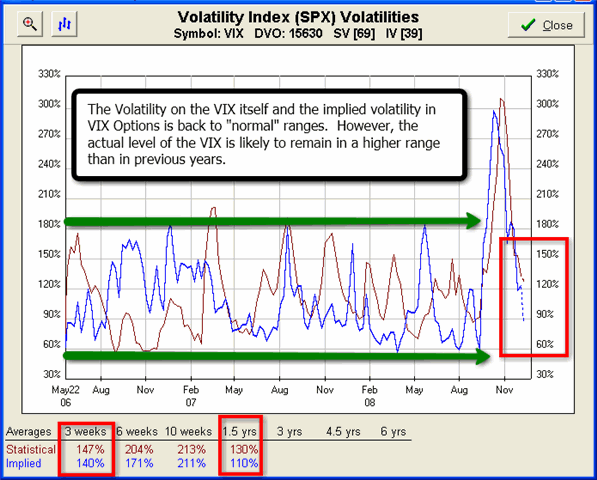
The following chart shows that both the actual volatility of the VIX and the implied volatility of VIX options has rapidly declined over the past month -- despite the VIX remaining at very historically high actual levels of over 50. The volatlity/implied volatility levels are back to the average range from 2006-2007, a time of much less volatility in the market and in the VIX. What this indicates to me is that we are likely to remain in a tighter range on the VIX over the coming weeks/months. While we are likely to remain in a historically higher actual range than normal, the moves within the range are likely to be smaller and the range itself should hold in place.
VIX Volatility & Implied Volatility Chart

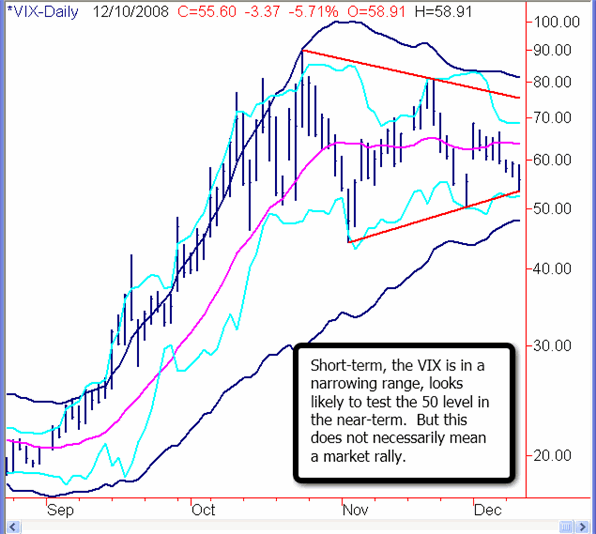
The Daily VIX Chart below also shows the tightening range, which can be seen by the red trendlines I have drawn. While we are at the bottom of this range and at the Bottom Bollinger Band, both of which have preceded short-term spikes in the VIX. I anticipate that the VIX is likely heading to 50 and possibly a bit lower over the near-term. However, this is not necesarily in line with a market rally, as one would expect. More likely is a continuation of this grinding slightly higher market, with volatility slowly dribbling lower, in my analysis.
VIX Daily Chart

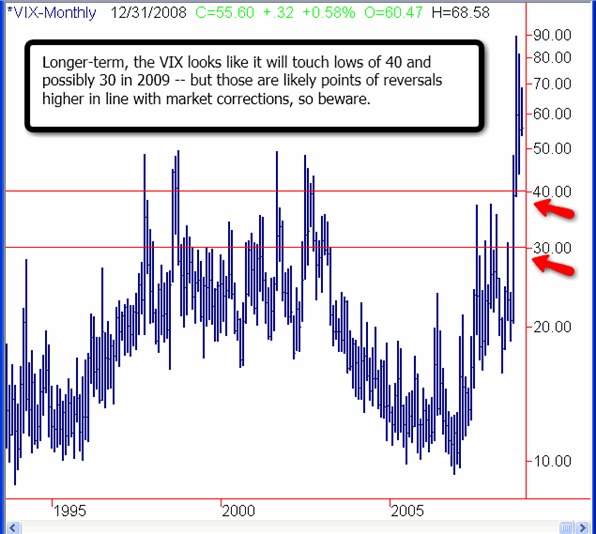
The long-term chart of the VIX going back to the early 1990's below shows that we have clearly broken above previous ranges. This chart looks to me as if we will have a new range on the VIX of 30/40 to 50/60 over 2009. Remember that volatility, and the VIX, tends to rise much more rapidly than it falls, in line with market selloffs. So as we approach 40, 35, 30 on the VIX, be ready to exit bullish positions and possibly put on bearish positions, anticipating a leg down in the markets and a spike in the VIX over the coming year.
VIX Monthly Chart

Bottom Line
A short-term grinding lower VIX can hurt buyers of option premium (Call and Put buyers, for example), so one way to avoid losing time decay is to look to buying In-The-Money (ITM) options with higher Deltas and less time premium priced into them. Another method would be to sell option premium, through the use of Advanced Strategies like Credit Spreads, Debit Spreads, Butterflies & Condors.
Price Headley is the founder and chief analyst of BigTrends.com.
|