| The McMillan Options Strategist Weekly |
| By Lawrence G. McMillan |
Published
12/12/2008
|
Options
|
Unrated
|
|
|
|
The McMillan Options Strategist Weekly
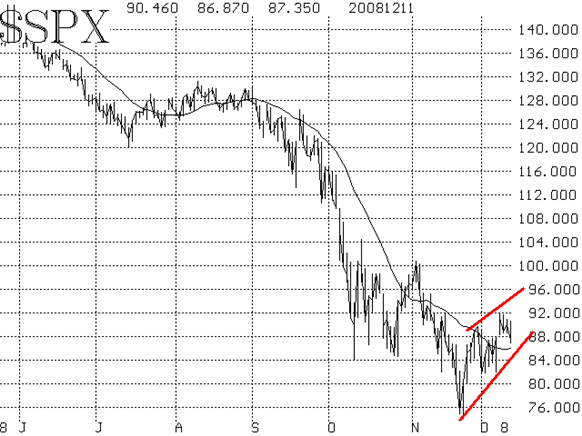
All through the decline since last August, we have refrained from turning bullish, mainly because the $SPX chart has not been able to interrupt its bearish downtrends. Recently, however, $SPX did manage to put together a "higher high, higher lower" pattern, and that tilts the intermediate-term picture towards the bulls. An uptrend line can now be drawn on the chart (Figure 1), connecting the late November lows, with the early December lows. As long as that uptrend line remains intact, we will view the market with a bullish bias. Currently, the trend line is at about 840 on $SPX, with the (still-declining) 20-day moving average at 850. We would not like to see that area violated. And, of course, a violation of the 820 December lows would be a very bearish development.

The market's overall response to a more positive SPX chart has been underwhelming. Today's breakdown below what had become short-term support at 885 was not helpful, and neither is tonight's continuing decline.
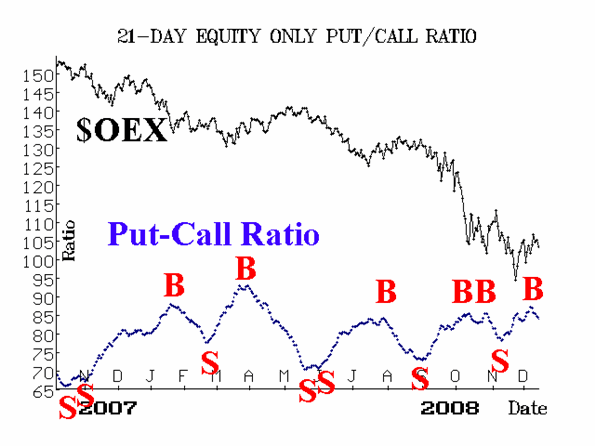
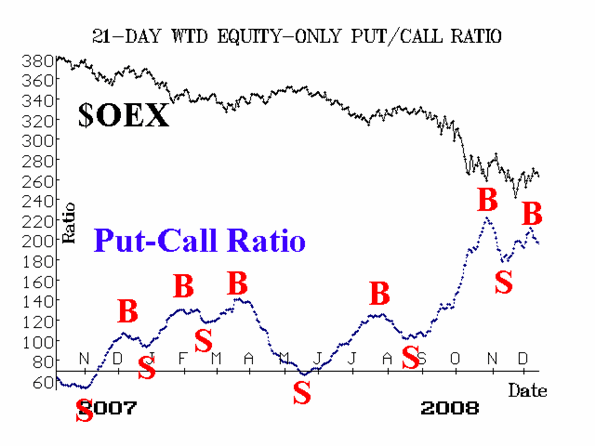
The equity-only put-call ratio charts had been wavering at very high levels recently, but just this week have rolled over to buy signals once again. This, of course, is a positive intermediate-term development, and should bolster the bullish case.

Market breadth has been quite positive since the late November lows However, a couple of days in which declining issues dominate advances could throw breadth back into sell signals.

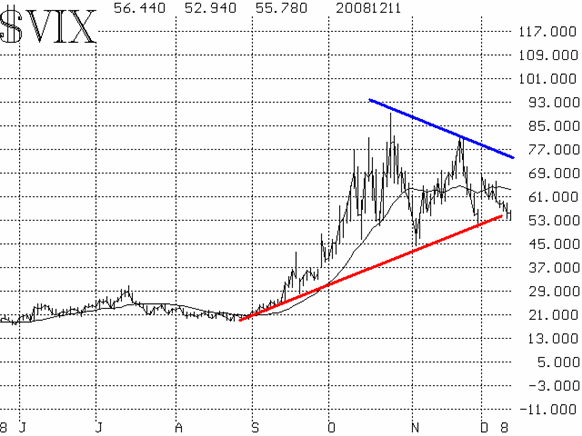
Volatility indices ($VIX and $VXO) have not responded with a bullish signal of their own. They remain, marginally, in uptrends. As long as that persists, they will continue to be bearish. If $VIX were to close below the 47-50 support level, it would be a bullish sign. The fact that $VIX didn't advance during today's market decline is considered as a positive divergence by some, but for our purposes, we need to see $VIX drop lower in order to generate a buy signal.

In summary, we are going to give the bullish case the benefit of the doubt as long as $SPX can remain above its rising trend line. So far, the bulls have failed to really capitalize on what are generally positive signals from our indicators. If the market can't rally when the indicators are positive (or if it rallies only weakly, as it did last July- August), then that usually means the next decline is a rather nasty one. A close below 820 would turn the entire picture bearish -- perhaps extremely so.
Lawrence G. McMillan is the author of two best selling books on options, including Options as a Strategic Investment, recognized as essential resources for any serious option trader's library.
|