| Outlook On The Stock Indices |
| By Price Headley |
Published
12/14/2008
|
Currency , Futures , Options , Stocks
|
Unrated
|
|
|
|
Outlook On The Stock Indices
NASDAQ Composite
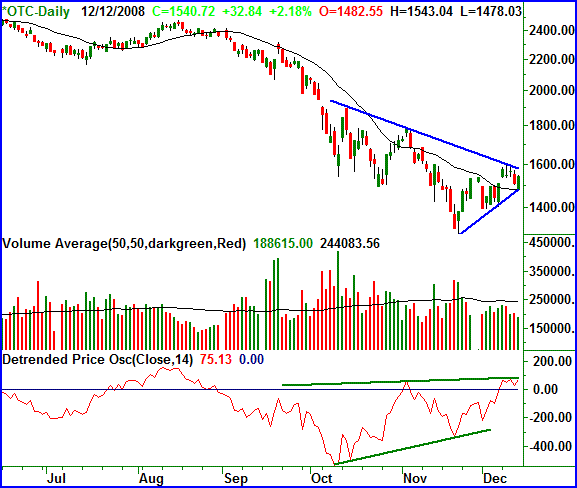
The NASDAQ composite salvaged what would've been a disastrous day on Friday with a 2.18% gain, after starting the day underwater by about the same amount. For the week, that meant a gain of 2.08%, or 31.41 points.
Last week the NASDAQ closed two important gaps: the one from December 1, and the one from December 8. This cleaned up any lingering unaccounted for business, meaning we don't have to worry about any additional unexpected retreats or advances just to fill in the blanks. Oh, and the composite also closed above its 20-day moving average line; that's bullish.
There are two other things we want to talk about -- the wedge (framed in blue), and the detrended price oscillator. The wedge speaks for itself. It's getting tighter, to the point where it will have to break at some point in the coming week. We'll wait and see which side breaks first before jumping to any conclusions.
The detrended price oscillator is probably going to be a new tool for the majority of you; it also might be one you want to add to your arsenal.
In a nutshell, the detrended isolator strips away the effects of a longer term trend or pattern, and highlights the actual short term trend. There's not enough time or space here to really get into how it works, but it may be worth some homework on your end.
In any case, notice how the detrended price oscillator has actually been rising since early October, and didn't hit a new low in mid November even though the market did at that point. The conventional interpretation of this tool would be bullish based on that higher low followed by last week's higher high. An even higher high in the coming week for the oscillator would be much more encouraging.
NASDAQ Composite Chart - Daily

S&P 500
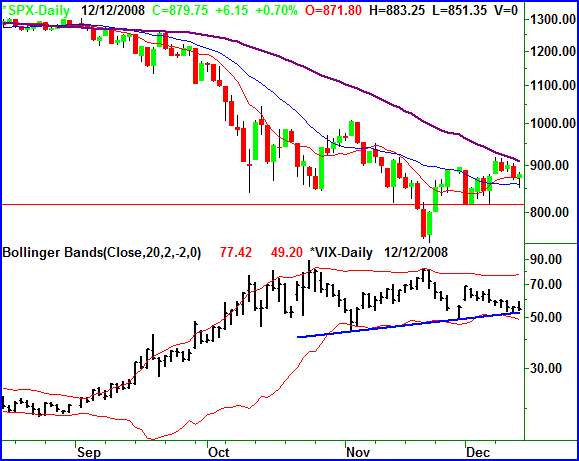
The S&P 500's gain of 6.15 points (+ 0.70%) on Friday left the index at 879.75. On a weekly basis, that translated into a gain of 0.42% (+ 3.70 points). However, don't get too excited just yet, the market was backpedaling for the majority of the week after an unusually strong Monday.
Since we talked at length about the NASDAQ's chart, and are going to talk at length about the Dow's chart, will focus more on the VIX for the S&P 500.
We've been waiting for weeks to see the VIX start to trend lower. We've seen temporary pullbacks from the VIX, but nothing permanent. However, there is an upside to all the recent up and down movement. We now have a pretty clear support line in place. When it breaks, we can feel much better about being bullish.
The support level on the chart of the VIX below is marked with a blue line. It's at 52.8 for right now, and rising slightly. The VIX closed at 54.28 on Friday, and is generally pointed lower. One way or another, the question is going to be answered soon. Until the support level actually breaks though, we don't want to get too far ahead of ourselves.
That said, we also want to see the S&P 500 break its 50-day moving average line as well before assuming anything. Support is at 814, while the 50-day line is at 910.
S&P 500 Chart - Daily

Dow Jones Industrial Average
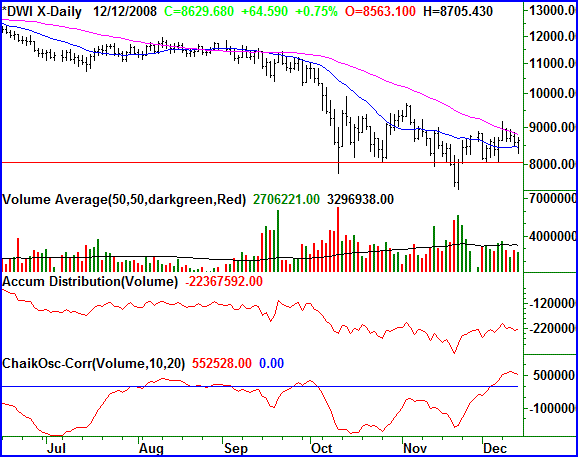
The Dow Jones Industrial Average rallied 0.75% (+ 64.59 points) on Friday to end the week at 8629.68. That, however, was still not quite enough to push the week into positive territory. Last week's close was 5.74 points (-0.07%) below the prior week's closing level.
Starting in mid November we finally began to see what could've been a light at the end of the tunnel. And we still may be seeing that light. However, it's pretty clear that the 50-day moving average line (purple) is going to be a big hurdle to cross; the weakness started right when it was tested.
On the other hand, it looks as if we saw support at the 20-day moving average line (blue) Thursday and Friday. So, the bulls and the bears find themselves at something of a stalemate.
Equally undecided is the volume trend. One of our biggest complaints in October and November about any bullish effort was the lack of bullish volume. Now, however, we can't quite say that. Bullish volume still isn't superb, but it's getting better.
Two of the specific tools we use to measure the volume trend are the accumulation-distribution line, and the Chaikin line. Both are shown on the chart below. As you can see, both were generally on the rise since mid November, yet both have tapered off in the last week.
From here, as long as the 20-day moving average at 8451 holds up as support (or 8050 in a worst case scenario) we can continue to be optimistic. But, until the 50-line moving average is breached on a permanent basis, we'll hold off on being fully bullish.
Dow Jones Industrial Average Chart - Daily

Price Headley is the founder and chief analyst of BigTrends.com.
|