| Corcoran Technical Trading Patterns For December 15 |
| By Clive Corcoran |
Published
12/15/2008
|
Stocks
|
Unrated
|
|
|
|
Corcoran Technical Trading Patterns For December 15
The resilience of US equities on Friday suggests that the market is seeing a glass that is half full rather than half empty.
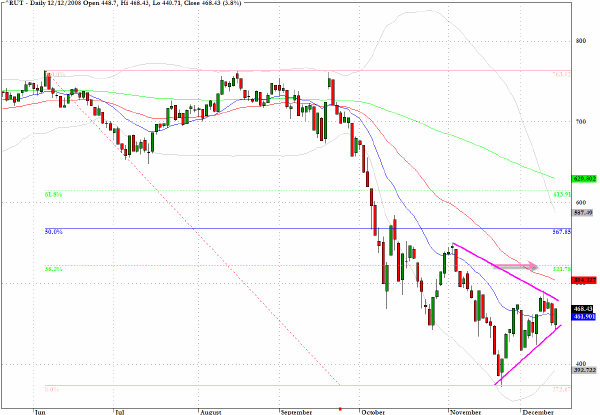
One of the more intriguing patterns on the charts is the pronounced triangle or pennant formation for the Russell 2000 (^RUT).
The 38% retracement of the 2008 high and low is to be found around 520 which would require a concerted effort by the bulls, but, seasonality and the sense that no matter how bad the economic numbers are the market can take them in its stride, could see us make significant progress towards this intermediate term target.
My gut feeling, not necessarily something that can be adequately justified by the charts, is that in Q1, 2009 the economic news could deteriorate so much that the half empty glass perception will become harder to avoid.
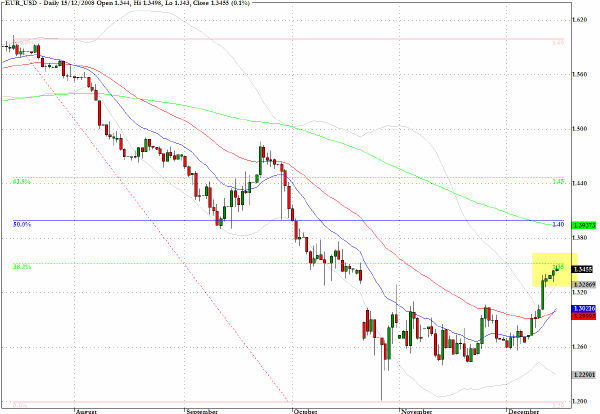
The Euro has more or less achieved the target I have been proposing in this column over the last month. At this level I would suggest that the easy money has been made on this rally and that I would be looking to retire short positions in general on the major cross rates against the dollar.
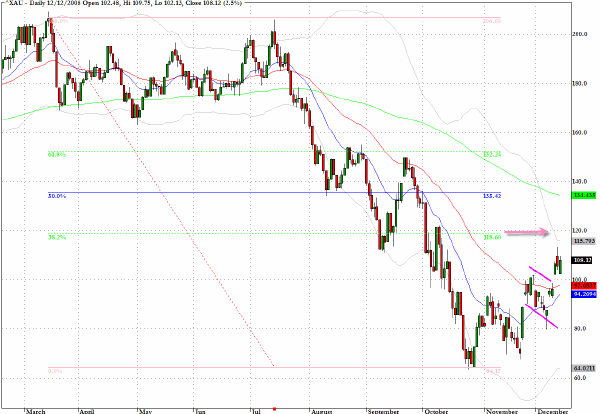
When discussing the chart for the Gold & Silver Index (^XAU) on CNBC's European Closing Bell last Friday, I pointed to two revealing features for this sector. The first is that this is one of relatively few sectors to be trading decisively above its 50-day EMA and secondly that the break away from the bull flag earlier this month suggests that there is further to go on the upside. The mining stocks could also benefit from the fact that there is some distance for them to cover in order to revert towards a more typical ratio between the price of gold and the miners.
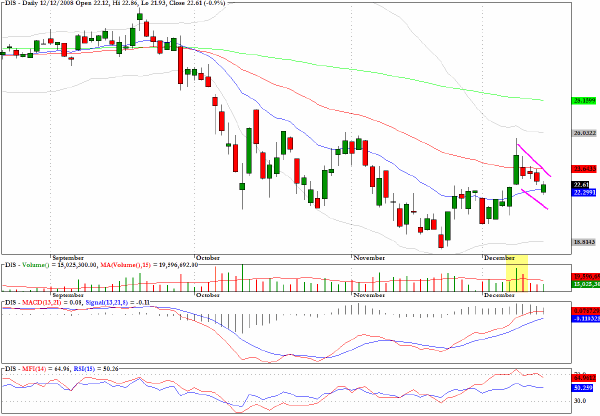
I would favor the long side with Disney (DIS) as the flag formation meets all of the requirements.
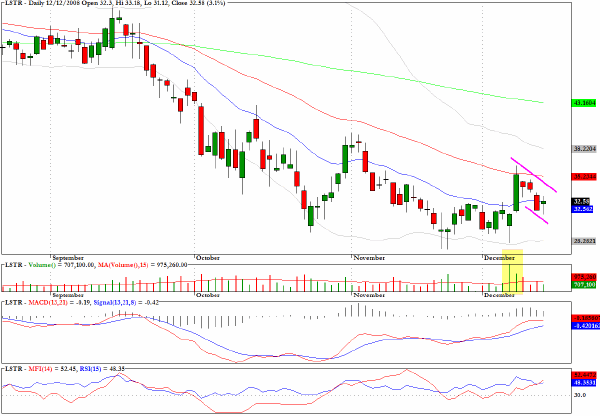
The chart for Landstar (LSTR) reveals a well defined bullish flag formation.
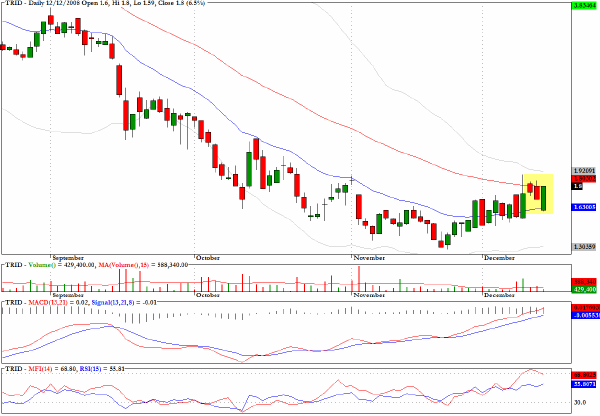
Yet another bullish pullback pattern can be seen on the chart for Trident Microsystems (TRID) although this stock already moved up substantially in Friday's trading and may have less on offer than the previous two bullish flag suggestions.
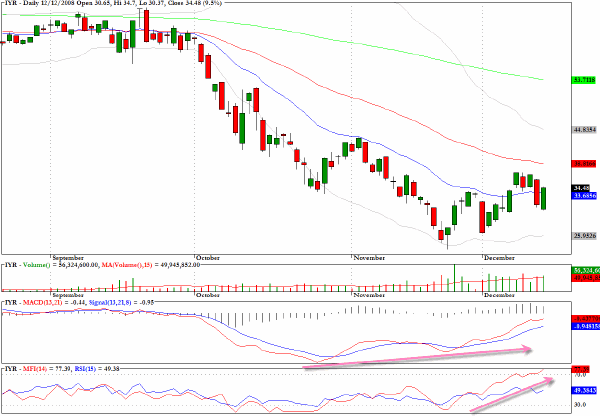
IYR, which tracks the Dow Jones Real Estate Index, is revealing some rather noticeable positive divergences.
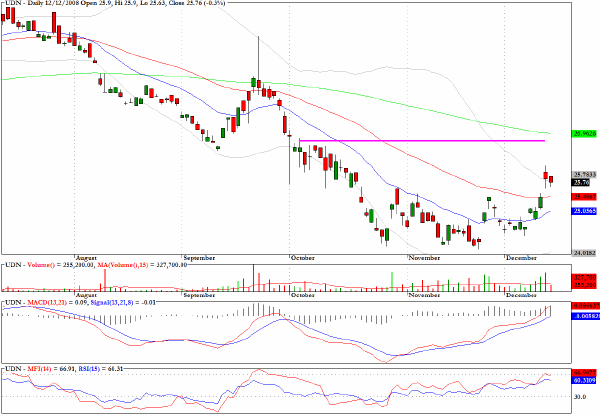
In the longer term I still favor lower values for the dollar index and this can be played via the inverse sector fund UDN. However given my prior analysis of the fact that the Euro has just achieved a major target and also from the evidence on the chart below, we can see signs of overhead resistance to further dollar weakness in the near term and I will be exiting this inverse fund later today and moving to the sidelines for the time being.
Clive Corcoran is the publisher of TradeWithForm.com, which provides daily analysis and commentary on the US stock market. He specializes in market neutral investing and and is currently working on a book about the benefits of trading with long/short strategies, which is scheduled for publication later this year.
Disclaimer
The purpose of this article is to offer you the chance to review the trading methodology, risk reduction strategies and portfolio construction techniques described at tradewithform.com. There is no guarantee that the trading strategies advocated will be profitable. Moreover, there is a risk that following these strategies will lead to loss of capital. Past results are no guarantee of future results. Trading stocks and CFD's can yield large rewards, but also has large potential risks. Trading with leverage can be especially risky. You should be fully aware of the risks of trading in the capital markets. You are strongly advised not to trade with capital.
|