| Corcoran Technical Trading Patterns For December 16 |
| By Clive Corcoran |
Published
12/16/2008
|
Stocks
|
Unrated
|
|
|
|
Corcoran Technical Trading Patterns For December 16
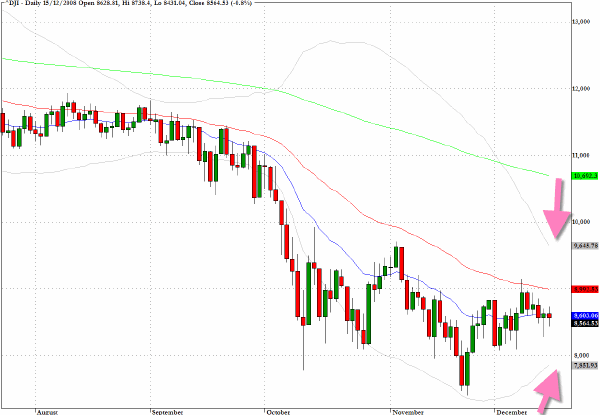
The arrows marked on the chart below for the Dow Jones Industrials (^DJIA) are intended to highlight the manner in which the volatility bands are constricting.
In turn this brings into focus the range-bound nature of trading since the recovery from the November 21 reversal.
Such range constriction could easily extend further but ultimately this kind of condition is usually a precursor to a decisive directional move. In the inimitable manner of the markets, the first break out of this range compression may not necessarily be indicative of the longer-term directional move, and it is possible we may see a "fake" move in today's trading.
Two events should predominate in today's trading. The first, which has largely been factored in already, is the decision by the FOMC. As always, most attention will be on the accompanying statement and any novel policy hints from Mr. Bernanke.
The other announcement that has the capacity to surprise or disappoint will be the earnings report from Goldman Sachs. The rather detailed anticipation of this number suggests that some leaking of the highlights may have already taken place and that the number may not be as negative as some traders are expecting.
The key upside target on the Dow is at the 9000 level which also coincides with the 50-day EMA. A drop below 8000 could definitely be a harbinger of another wave downwards for US equities.
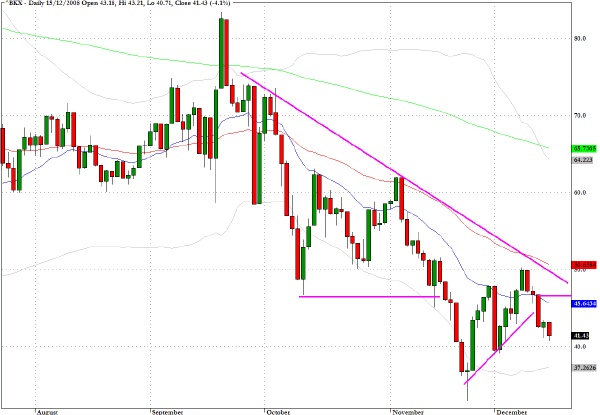
The daily chart for the KBW Banking Index (^BKX) reveals an intriguing and negative pattern which is suggesting that market participants are still viewing this sector as not yet through its major difficulties.
The major descending wedge pattern is clearly evident and the drop below the baseline of that again, following the late November rebound, is unsettling. Underlining this concern is the evidence that the uptrend line for the recovery pattern itself has been violated which could portend a retreat to the November 20 lows again.
Very strong resistance can be assured at the $45 level.
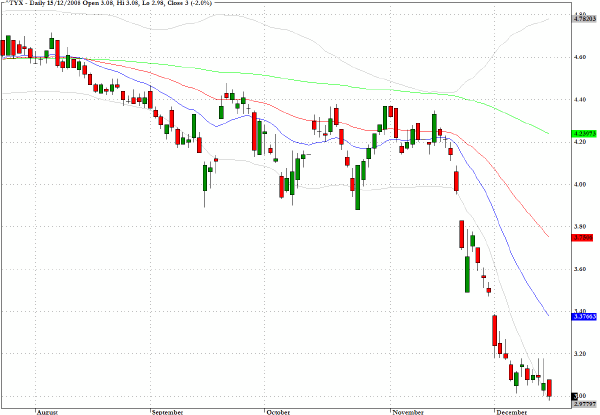
The thirty-year US Treasury Bond closed yesterday's session at exactly 3% yield after flirting intraday with yields below that level and close to historic lows. Traders are anticipating that the Federal Reserve will go on record with acknowledging its policy to purchase government debt at the long end of the yield spectrum and the FOMC statement today may well provide that formal declaration.
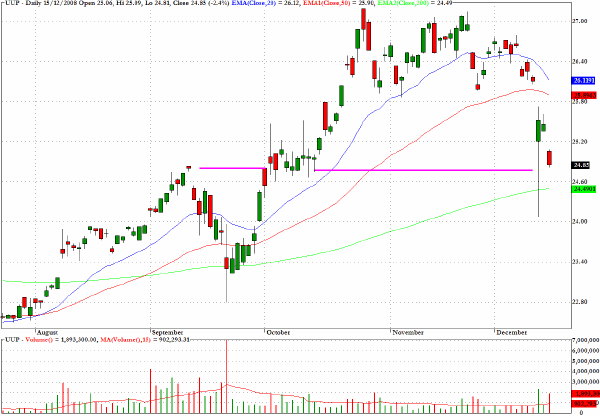
As discussed in yesterday's column, I exited my short position on the US Dollar Index. The chart for the positive stance on this index, UUP, reveals most graphically the possibility that recent selling of the US currency could have been somewhat overdone.
Any kind of shock announcement by the FOMC as part of the statement accompanying the rate decision this afternoon could conceivably trigger another bout of selling, but it is more likely that a consolidation phase could now unfold.
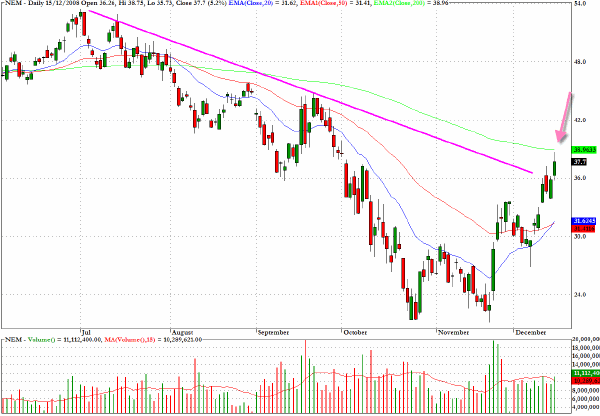
In accordance with yesterday's recommendation on the gold mining stocks, Newmont Mining (NEM) performed well and could have returned, at its best levels, about 7% on the session. The chart reveals a penetration of a key trend line through the highs but also suggests that the rally could encounter some resistance at the 200-day EMA (the green line on the chart).
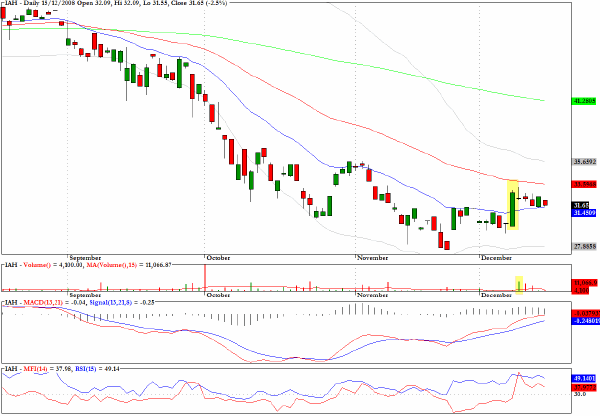
IAH, an exchange traded fund with the rather unusual title Internet Architecture Holders, but which essentially tracks numerous technology companies including major holdings in IBM, Cisco (CSCO) and Apple (AAPL), is displaying a bullish flag formation.
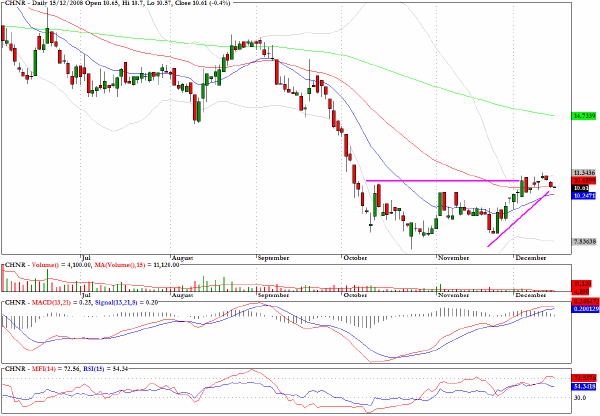
China Resources (CHNR) has most of the characteristics that one looks for in an ascending wedge pattern that could precede an upward breakout. Recent price action has been somewhat erratic so, as always, prudent position management would be the way to go.
Clive Corcoran is the publisher of TradeWithForm.com, which provides daily analysis and commentary on the US stock market. He specializes in market neutral investing and and is currently working on a book about the benefits of trading with long/short strategies, which is scheduled for publication later this year.
Disclaimer
The purpose of this article is to offer you the chance to review the trading methodology, risk reduction strategies and portfolio construction techniques described at tradewithform.com. There is no guarantee that the trading strategies advocated will be profitable. Moreover, there is a risk that following these strategies will lead to loss of capital. Past results are no guarantee of future results. Trading stocks and CFD's can yield large rewards, but also has large potential risks. Trading with leverage can be especially risky. You should be fully aware of the risks of trading in the capital markets. You are strongly advised not to trade with capital.
|