Archer Daniels Midland (ADM) is one of relatively few stocks attempting to climb above its 200-day EMA.
Yesterday's candlestick pattern for the Nasdaq 100 (^NDX) fits the specification for a triple formation that I have discussed in some depth in Long/Short Market Dynamics. The pattern represents an Inside Doji and moreover completes the trio since it is also an NR7, or narrowest range in seven.
The presence of these tiny range inside day formations suggests that the market is setting up for disambiguation of its directional uncertainty.
The main obstacle that has to be overcome for most indices is their respective 50-day EMA thresholds. In addition, traders are also facing the backdrop of unprecedented monetary policy, talk of an $850 bn fiscal stimulus, ten-year Treasury yields approaching two percent and a rather scary selloff in the dollar.
Chart dynamics are suggesting that an upward breakout is being anticipated by the markets but the lack of conviction, as reflected in paltry volume, suggests that nothing can be taken for granted.
The split nature of the market's appetite for risk is highly unusual and suggests that while some asset allocators are moving back into more speculative sectors of the capital markets there are still many more that are hiding out. The suspicion is that even those institutions that are accumulating dollar denominated instruments are very keen to lay off the currency risk. 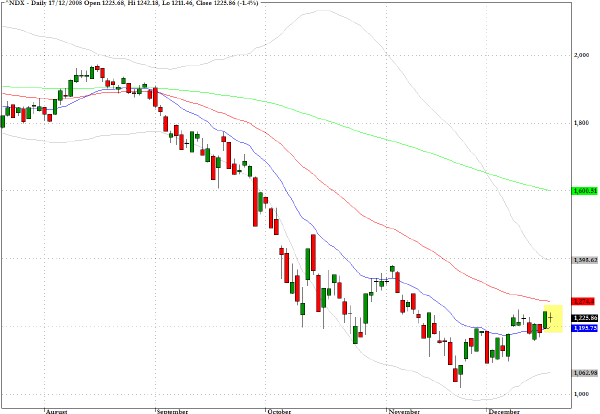
Despite the onset of fatigue from all of these historic market developments, I have to confess that I find it astonishing that the yield on the 10-year Treasury note is approaching two percent and even more astonishing that within the last three months the yield to maturity in this colossal financial asset class has almost been cut in half.
When the mania for safe haven yields and the policy of quantitative easing has run its course, the bursting of this new bubble will have us searching our Thesauruses for new hyperbolic adjectives. 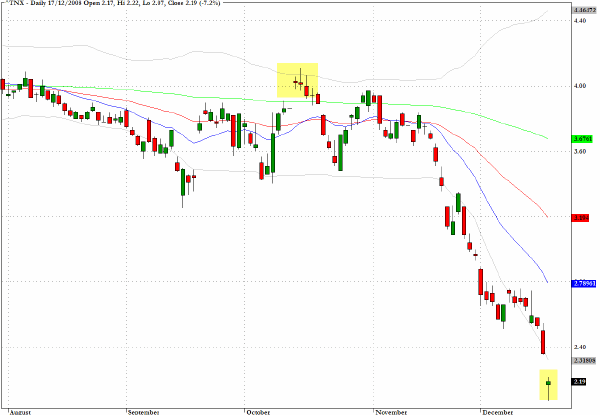
Underlining the unusual opportunities for even crude arbitrage strategies in the fixed income markets, and at the same time illustrating the market's split personality to risk aversion, on a day when the yields of Treasuries plunged, the junk bond market saw some concerted buying.
The ETF for the sector shows a substantial increase in volume and a break above a descending downward trend-line. 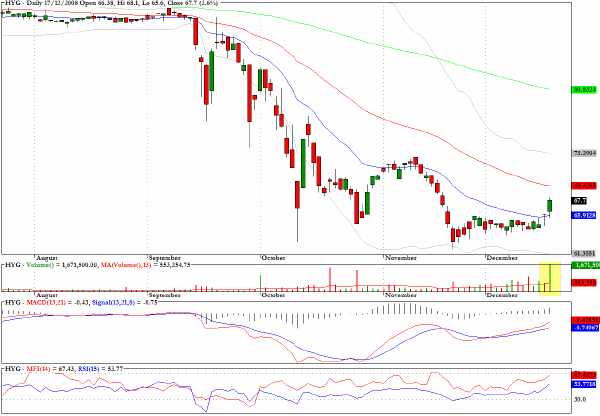
While many celebrated pundits are heaping praise on the brilliant and innovative strategy now being followed by the Federal Reserve some asset allocators are piling into the Swiss Franc. The chart for the sector fund FXF illustrates the parabolic rise of that currency in the last few sessions.
If this move continues one should expect a similar move in gold as well. 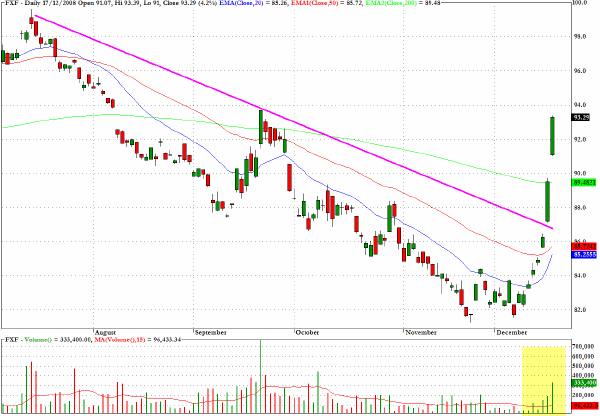
The Australian dollar, which can conveniently be traded via the FXA fund, should be headed for a test of the 38% retracement level around 74 cents against the US currency. 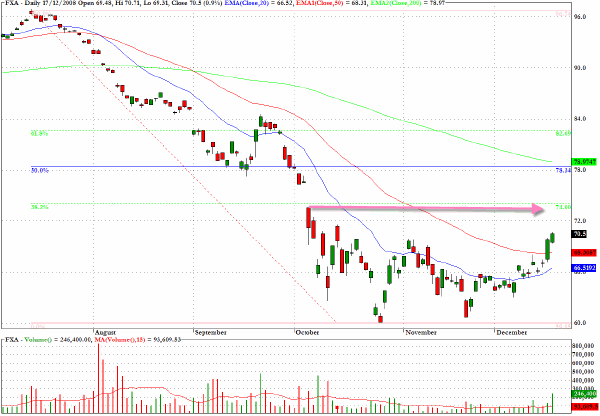
The chart for American Express (AXP) reveals a further potential break down which could take out the baseline of the wedge pattern. 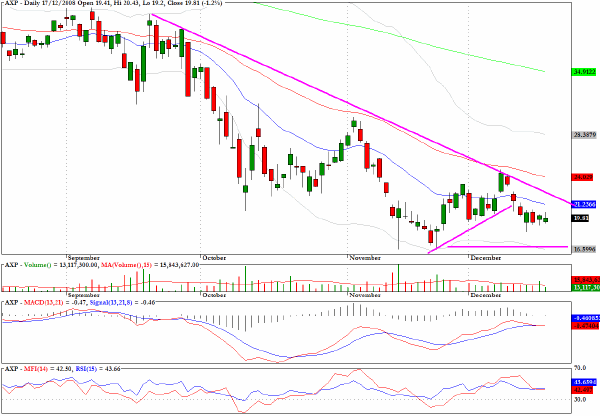
Archer Daniels Midland (ADM) is one of relatively few stocks attempting to climb above its 200-day EMA but as the chart suggests it appears to be meeting some strong resistance and the momentum appears to have temporarily peaked. 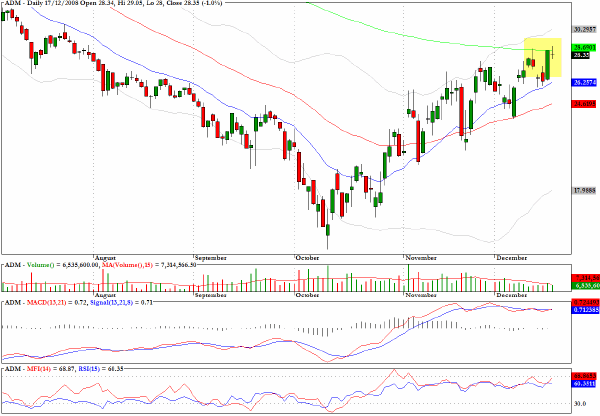
I still favor the long side with Disney (DIS) as the flag formation is continuing to build in accordance with the pattern's requirements. 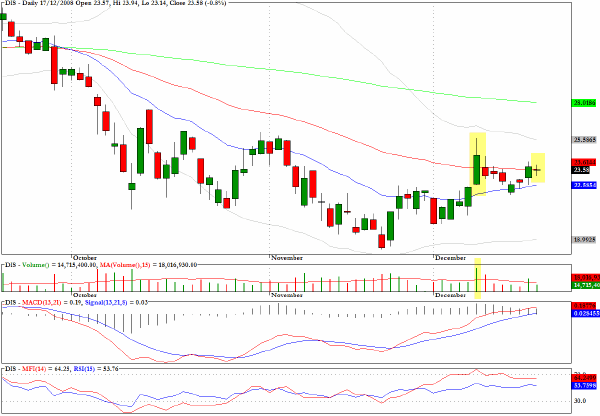
Clive Corcoran is the publisher of TradeWithForm.com, which provides daily analysis and commentary on the US stock market. He specializes in market neutral investing and and is currently working on a book about the benefits of trading with long/short strategies, which is scheduled for publication later this year.
Disclaimer
The purpose of this article is to offer you the chance to review the trading methodology, risk reduction strategies and portfolio construction techniques described at tradewithform.com. There is no guarantee that the trading strategies advocated will be profitable. Moreover, there is a risk that following these strategies will lead to loss of capital. Past results are no guarantee of future results. Trading stocks and CFD's can yield large rewards, but also has large potential risks. Trading with leverage can be especially risky. You should be fully aware of the risks of trading in the capital markets. You are strongly advised not to trade with capital.