NASDAQ COMMENTARY
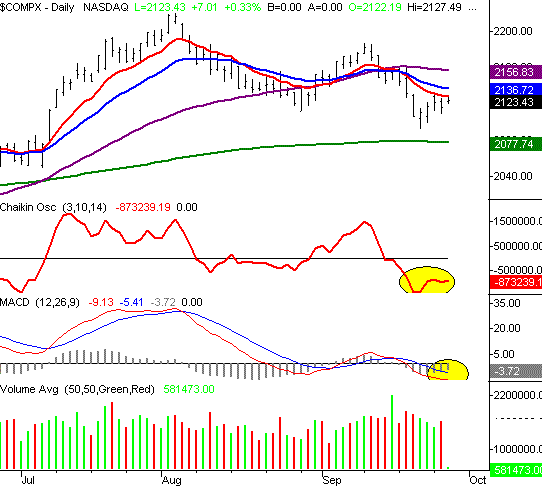
We hate to keep bringing it up, but the 10 day moving average continues to be a barrier for the NASDAQ. We've hit it three straight days (including today), but have yet to even trade above it, let along close above it. Today's high (so far) is 2127.49, and the 10 day moving average is at 2128.31. Clearly we're right there on the verge, but until we can break through, we can't assume it's going to happen.
However, the composite is up for the week, and most of the key indicators are starting to look a little more bullish (although none are quite there yet). Since last Friday, the NASDAQ is up about 10 points (+0.5%), and we've seen enough bullish pressure to force higher highs and higher lows for two of the three days this week. As a result, the MACD lines - which had been decidedly bearish - are now turning around. There's no bullish crossover yet, and there may never be, but we're keeping an eye out for one. Similarly, the Chaikin line had been in a steep drop, telling us the selling volume was growing behind the early-September tumble. But it too has started to curl upward again. It's still quite a bit away from giving us an official buy signal, but that too is something we're going to be watching for over the next few days. (Note, however, that the bullish volume bars have been shrinking, while yesterday's bearish volume was pretty solid. The bulls will have to come out in better numbers if there's to be any chance of a break past 2127.)
So there it is. It all ultimately hinges on that 10 day line - none of the technical indicators will turn bullish if the composite can't move past that important short-term moving average. For now, we remain patient.
NASDAQ CHART - DAILY

S&P 500 COMMENTARY
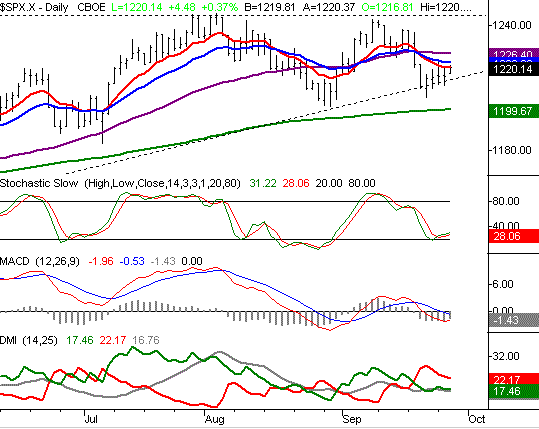
The S&P 500 chart looks something like the NASDAQ's but there are a couple of minor differences. The biggest one is the fact that the SPX has managed to trade above the 10 day line recently, by hitting 1222.56 on Monday, and getting to 1220.98 today. Both of those highs were above the 10 day line. As for Tuesday, the high of 1220.08 was pretty much where the 10 day average was then, so there's still at least some resistance with the 10 day line. The other resistance point that was defined this week was the 20 day average, it's currently at 1222.21, but served as the cap for the index on Monday by keeping the index under 1222.56. The point of all this is not to give a lesson in all the possibilities of short-term resistance....that's all clear. Our only point is to illustrate that we're right at a fairly wide wall of short-term problems that could keep the S&P 500 from going any further. At this point, until (and unless) the index can get above the 50 day line at 1226.39, we don't see any potential reward justifying the risk, even though the momentum seems to be turning slightly bullish from here.
That said, the day isn't over yet, and we've seen some major pressure pushing and keeping the S&P 500 above the 10 day line for most of the sessions. That may be enough to keep it there by the time the closing bell rings. But will that be enough to turn us bullish? Not quite. As we mentioned above, we'd rather see a move all the way past the 50 day line to get excited.....but the close above the 10 day average would be a good start.
Our hesitance is also rooted in the technical indicators we've charted below. Like the NASDAQ, many of them are "almost bullish," but we can't jump the gun. The stochastic lines have created a half-hearted buy signal, and that we have a bullish crossover. However, neither stochastic line got into that deep "oversold" territory, so we're not primed to get that good sling-shot effect. The MACD lines might be poised for a bullish cross, and the DMI lines might be poised for a bullish cross, but those are some very big 'might's'. We can't afford to assume we'll see it happen, especially with the market struggling to even make it meaningfully higher with this first attempt at a recovery. Be patient here as well, because this chart is still largely untelling.
S&P 500 CHART - DAILY

DOW JONES INDUSTRIAL AVERAGE COMMENTARY
Oddly, the Dow Jones Industrial Average is the closest of all three indexes to a major buy signal. Then again, it had the least amount of ground to reclaim. as it really didn't take a big hit earlier in the month.
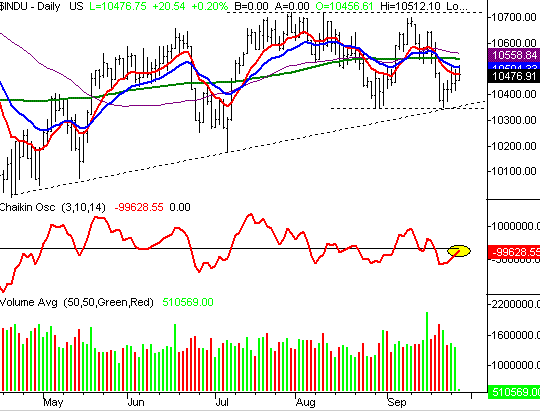
The 10 day lines seems to be a non-issue here, but the 20 day moving average has kept the Dow at bay this week. The average is currently above the 10 day line, but today's high of 10,512.10 is the second time this week a rally has been stopped at the 20 day line, which is currently at 10,505.72. So like all the indexes, there are some short-term hurdles that need to be taken care of first before we can even think about looking further out.
By the way, the buy signal that's almost complete is the Chaikin line cross above zero. Once today's volume data is in, and provided the Dow closes with at least a modest gain, we'll probably have it. Note that the Dow is also on track to closing above the 10 day moving average, which will be enough of that 'modest gain' to clinch the Chaikin-based signal.
But from a bigger perspective, the Dow is still choked on its own lethargic chart. We've defines support at 10,350 twice, and defined resistance at 10,700 twice in the last two months. So even if the Dow can break past the 50 day line at 10,560, the potential is going to be limited to less than 200 points before a wall is hit again. It won't be until we can break out of that zone (on either side) that traders will get some decent movement.
DOW JONES INDUSTRIAL AVERAGE CHART - DAILY

BOTTOM LINE
No doubt about it - these charts are ambiguous right now. The recent momentum certainly looks bullish, but don't forget that stocks got pounded into an oversold condition last week, and a bounce was likely. From a sentiment perspective (which we don't chart in this analysis), stocks really do look ripe for an upside move, but until we get at least some evidence that they're actually willing and able to do that, we're going to very cautious here. The one thing we've seen a lot of this year is short-term reversals, and we don't want be on the wrong aside when we get the next one.
Price Headley is the founder and chief analyst of BigTrends.com.