| Corcoran Technical Trading Patterns For December 19 |
| By Clive Corcoran |
Published
12/19/2008
|
Stocks
|
Unrated
|
|
|
|
Corcoran Technical Trading Patterns For December 19
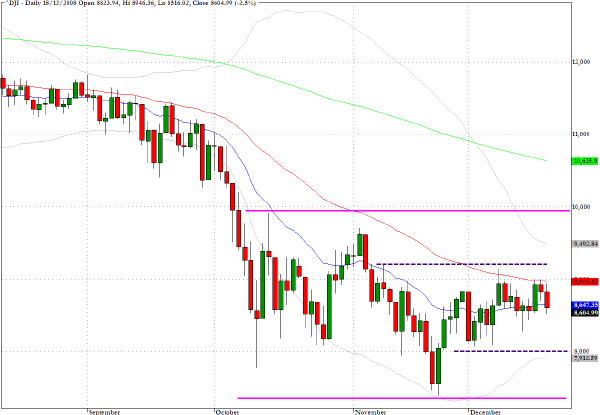
The Dow Jones Industrials (DJIA) has remained essentially range-bound within the dotted lines since the sharp drop below the 8000 level in late November. While it meanders within this range it is hard to get too excited one way or the other about the day to day fluctuations.
The larger range, since the precipitous falls in early October, has been clearly delineated with the continuous line and those levels remain the more critical levels to watch during the increasingly less liquid trading conditions that will now characterize trading conditions during the remainder of the year.
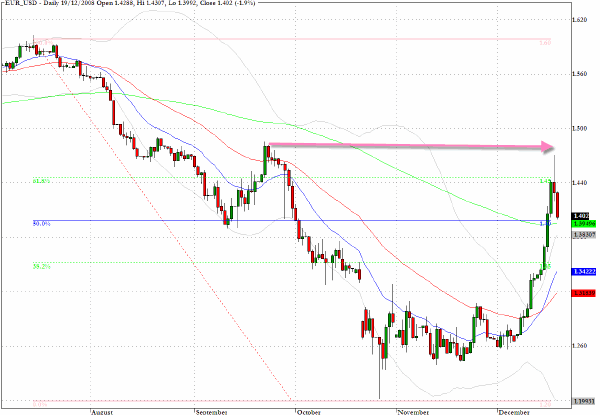
The euro encountered strong selling resistance around $1.48 but did manage to spike above the 62% retracement level. The drop yesterday was sharp and quickly brought the currency back to the $1.40 level where I shall be watching for a pullback pattern to emerge.
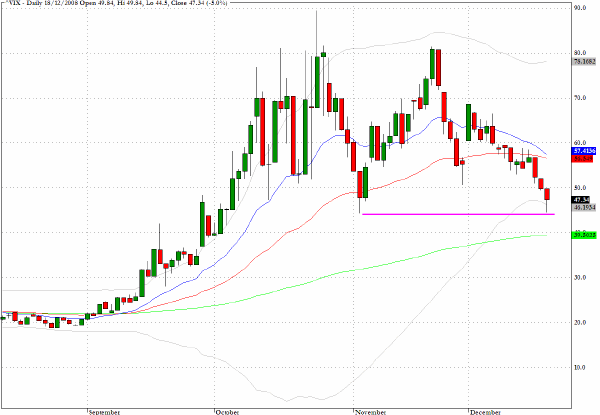
Despite a late sell-off in the major indices the VIX declined on the session.
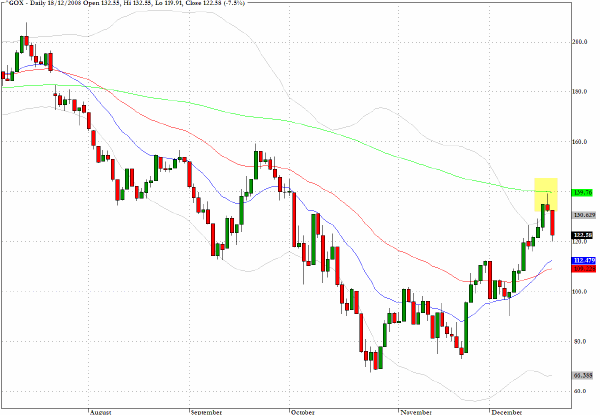
The Gold Index (^GOX) also encountered resistance at the 200-day EMA and somewhat in accordance with the outlook for the euro there could be a retrenchment to the 50-day moving average in a flag-like pattern.
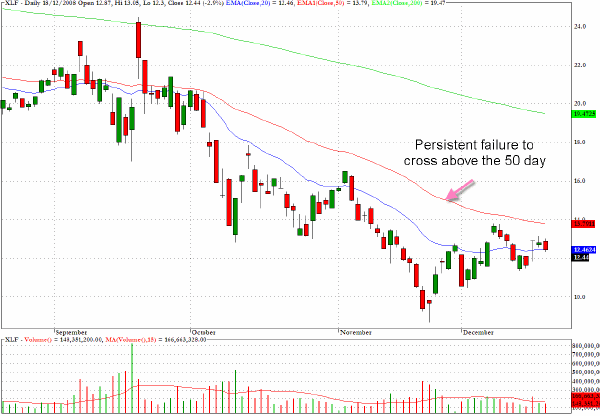
The financial services fund, XLF, clearly reveals the persistent failure of this sector to rise above its 50-day EMA.
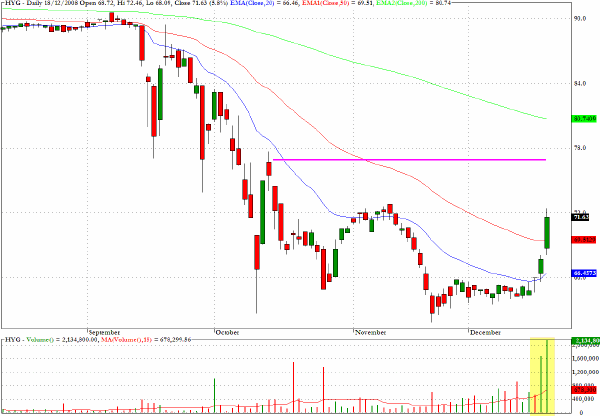
HYG, which tracks the high yield corporate bond market, continued its rally Thursday and should seek out the target suggested on the chart.
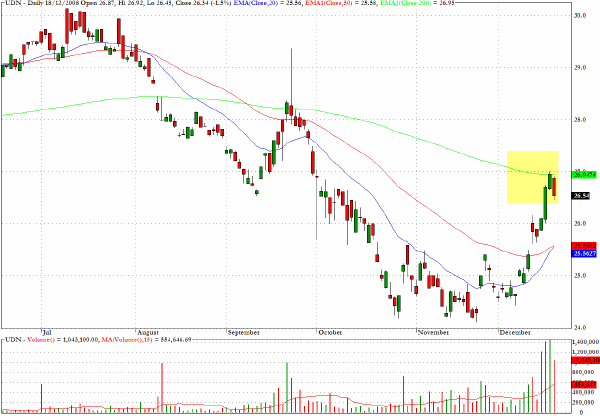
The exchange traded fund UDN, which moves inversely to the dollar index, encountered resistance exactly at the 200-day EMA and a period of consolidation is now likely before further dollar weakness is to be expected.
Clive Corcoran is the publisher of TradeWithForm.com, which provides daily analysis and commentary on the US stock market. He specializes in market neutral investing and and is currently working on a book about the benefits of trading with long/short strategies, which is scheduled for publication later this year.
Disclaimer
The purpose of this article is to offer you the chance to review the trading methodology, risk reduction strategies and portfolio construction techniques described at tradewithform.com. There is no guarantee that the trading strategies advocated will be profitable. Moreover, there is a risk that following these strategies will lead to loss of capital. Past results are no guarantee of future results. Trading stocks and CFD's can yield large rewards, but also has large potential risks. Trading with leverage can be especially risky. You should be fully aware of the risks of trading in the capital markets. You are strongly advised not to trade with capital.
|