| Outlook On The Stock Indices |
| By Price Headley |
Published
12/21/2008
|
Currency , Futures , Options , Stocks
|
Unrated
|
|
|
|
Outlook On The Stock Indices
NASDAQ Composite
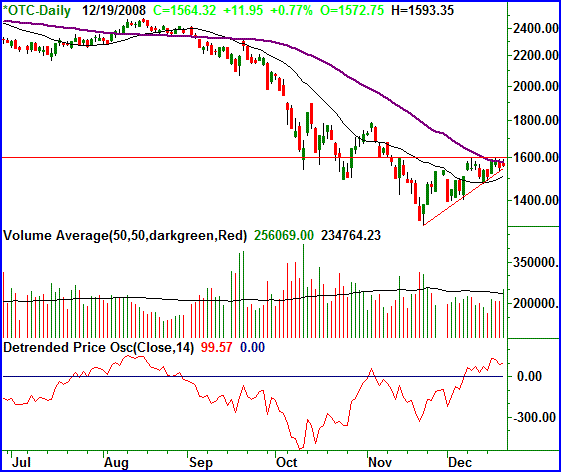
The NASDAQ Composite gained 11.95 points on Friday (+0.77%) to close out at 1564.32. On a weekly basis, the composite gained 8.15 points (0.93%). That gain, however, was not enough to clear a key hurdle. We'll be pointing this out for all the indices, but the NASDAQ is at a key inflection point come Monday.
On the chart below we've framed the NASDAQ within two red lines, the wedge we've been talking about off and on for a while now. Well, the wedge is going to come to a tip next week, and the composite will have to move above or below it.
At the same time, the NASDAQ has certainly been testing the 50-day moving average line (purple), but hasn't yet gotten past it. Of course, to make matters trickier, that line is right in the middle of the wedge.
While the wedge is our focal point, also notice how the 20-day moving average line (the only other line on our chart) is well under the lower side of the wedge, at 1510. That could also play a support role if any sell-off isn't too harsh. So, we'll probably be tolerant of a dip that low, even though it would technically breach the wedge's support line.
In fact - and despite all the possible pitfalls - we're actually bullish based on the bigger-picture chart. Getting above the 50-day line and 1600 is critical though.
NASDAQ Composite Chart - Daily

S&P 500
The S&P 500 ended Friday in the black barely, with a 2.6 point (+0.29%) gain. The close of 887.88 was still good enough for a 23.6 point (+1.53%) improvement on the prior week.
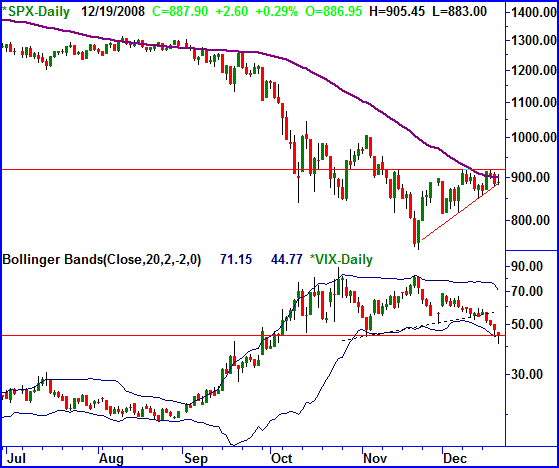
Remember the conversation we had about the NASDAQ's wedge and 50-day moving average line? Ditto for the S&P 500. They're all marked on the chart.
The item of interest (to us) on this chart is of course the VIX, which broke under one support line, but was held up at another.
The dashed line on the VIX's chart was the short-term headache, but it was taken care of early last week. Since then, the 20-day Bollinger band's lower line as well as a prior low for the VIX seem to be in play again.
As you can see, the VIX hadn't touched that lower Bollinger band until Friday. However, as you can also see, each brush with the lower 20-day Bollinger band has not been good news for the bulls. Moreover, you can see what happened once the VIX tested a new multi-week low under November's low, it was pushed higher again. Perhaps those lines in the sand weren't meant to be crossed yet.
On the other hand, last week was expiration week, which can cause erratic behavior from the VIX. We really need to see how this chart takes shape before jumping to any conclusions. Based on the VIX though (and despite our otherwise-optimistic view), this is a pretty big problem the bulls will need to solve soon. The only solution is to keep driving the lower band even lower.
We're only fully bullish if the S&P 500 can break above 919. A move under 850 will be a bearish omen.
S&P 500 Chart - Daily

Dow Jones Industrial Average
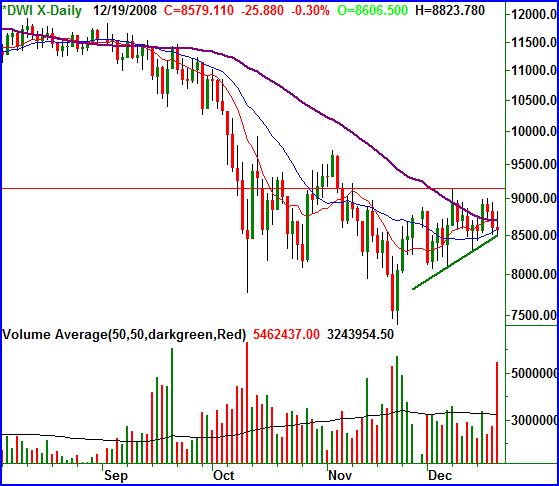
The Dow Jones Industrials Average was the only index to lose ground on Friday, thanks largely in part to Citigroup's loss along with and a couple of big oil stocks. The blue chip index closed at 8579.11, down 25.88 points (-0.3%). The Dow was also the only loser on a weekly basis, closing 50.57 points under (-0.59%) the previous week's close.
There's no need to rehash the wedge discussion (or the 50-day line discussion) again for the Dow's chart. All the indices are at an inflection point.
While it's still been very volatile from day to day, and while we're still seeing the indices hop back and forth around their short term (10- and 20-day) moving averages, it's worth noting that those two short-term lines (red and blue, respectively) are close to crossing above the 50-day moving average line (purple). That's a hint of a bigger-picture momentum change.
It's still not a sure thing - the Dow needs to break its ceiling too, which it hasn't yet. But, this is the best shot at a rebound we've taken in weeks.
Dow Jones Industrial Average Chart - Daily

Price Headley is the founder and chief analyst of BigTrends.com.
|