| Corcoran Technical Trading Patterns For December 23 |
| By Clive Corcoran |
Published
12/23/2008
|
Stocks
|
Unrated
|
|
|
|
Corcoran Technical Trading Patterns For December 23
This will be my last commentary for 2008, which must rank in the annals as one of the most extraordinary years ever in the financial markets.
To conclude the year and to tie in with some charts that I intend to present on CNBC's European Closing Bell this afternoon, I'll focus on three long-term monthly charts and explore the question of just how unusual recent price action has been for several key markets.
In two cases, the charts go back to early 1987 and in the case of the third, the KBW Banking Index (^BKX), the period begins with the commencement of this index in 1993.
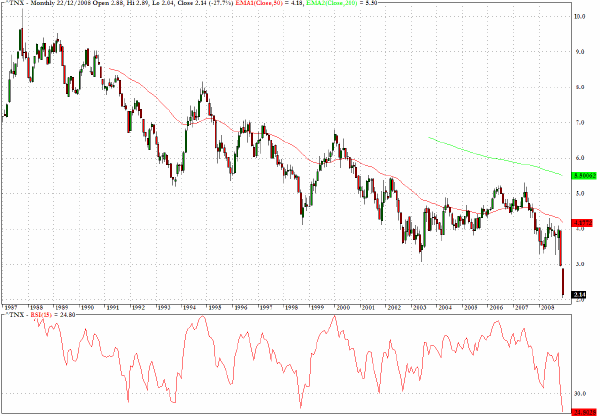
To begin, my favorite chart for 2008 is the 20-year perspective on the yield for the ten-year Treasury Note (^TNX). On the far left hand side of the chart can be seen the yield moving above ten percent in 1987, which was a primary contributing factor to the October 87 Crash. The steady decline in yields within the context of a descending wedge pattern is really uncanny and shows how those seeking consistent and "safe" income from the capital markets have been increasingly challenged as the focus moved to capturing short-term capital gains from more speculative investments.
The last candlestick on the right hand side is the most shocking of all and shows that we are in uncharted waters.
In order to underline the fact that all analysts are currently facing unusual challenges in making sense of these charts, I tried several well known technical analysis indicators (e.g. MACD, Stochastics, TRIX, etc) but finally settled on the Relative Strength Index (RSI). As the chart reveals, this indicator has reached below the 30 level on just a few occasions. Welles Wilder, who developed the index, considered the 30 level to be an oversold level (or in the case of bonds since price moves inversely to yield this would need to be considered as an overbought level).
The current reading from the monthly application of the indicator is at 24 and this surpasses any previous low reading and suggests that we are either entering a new regime where the risks of global deflation should cause us to suspend the notion that bonds could be overbought in any normal trading sense, or that we are on the verge of a major sell-off in Treasuries.
I suspect that the accumulation of Treasuries is far from over and this presents the possibility that the applications of the RSI in relation to other indices and asset classes must also be subject to doubt.

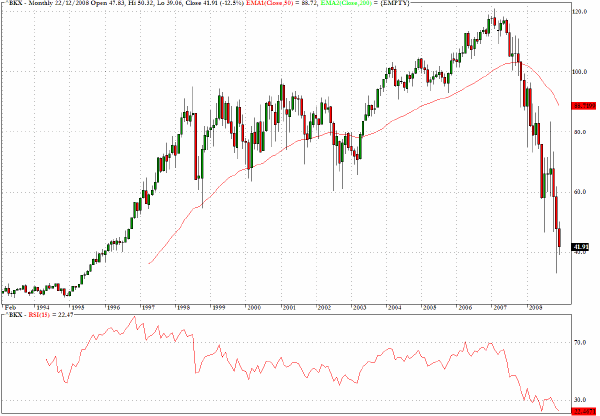
The monthly chart for the KBW Banking Index (^BKX) has a slightly shorter history than the period covered in chart for the Ten Year note yield, but still provides another dimension to the notion that the current financial climate is unprecedented. The RSI value until recently had never dropped below the 30 level but over the last two years we are pursuing new lows just above 20. There is some indication that a double bottom may be setting up but I would hesitate about reading too much significance into that.
The fact that there is no precedent for this kind of persistent weakness in the banking sector, and a failure to rally on a supposed oversold condition if one uses the normal interpretation of RSI, suggests that one should suspend the notion that this is in any sense a "normal" trading environment.

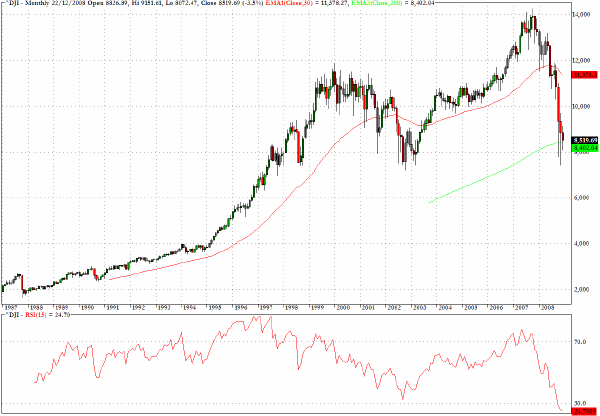
I looked at several of the major US equity indices in relation to the framework that I have outlined for the two charts above and there is relatively little difference between the results obtained on the long-term charts. The index which perhaps most vividly brings out a continuation of the notion that things are different this time is for the Dow Jones Industrials Average (DJIA). The reading on the RSI segment of the chart shows a value of 24 and this is considerably below the other basing period on the chart in 2003, which interestingly did conform to the Wilder notion that 30 was a good level to look for a recovery.
To summarize quickly the upshot of the material just presented, my view is that the financial economy has undergone a major transformation in the last two years, to put it rather pompously one could talk of a paradigm shift.
Many consequences flow from this momentous change and they should make one cautious about many matters but especially about assumptions relating to earnings forecasts for the entire financial sector and, in turn, the broader economy. If the business model for the banks and other financial intermediaries is "broken" then it will need to be replaced with another engine to power future economic growth.
It would be foolish to claim that all of the growth since the 2003 recovery was illusory and based on an over-leveraged banking system and over-optimized credit creation processes, but there is now a real question mark as to where the catalyst for future dynamism in the economy is going to come from.
In the meantime I wish all readers of this column the best compliments of the season and prosperity and good health in 2009.

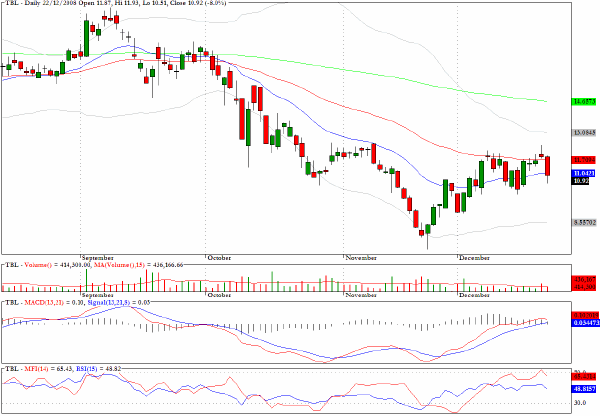
In yesterday's commentary I suggested that Timberland (TBL) appears ready to correct after recovering into an area of chart resistance.
An eight percent return could have been realized on the session.

Clive Corcoran is the publisher of TradeWithForm.com, which provides daily analysis and commentary on the US stock market. He specializes in market neutral investing and and is currently working on a book about the benefits of trading with long/short strategies, which is scheduled for publication later this year.
Disclaimer
The purpose of this article is to offer you the chance to review the trading methodology, risk reduction strategies and portfolio construction techniques described at tradewithform.com. There is no guarantee that the trading strategies advocated will be profitable. Moreover, there is a risk that following these strategies will lead to loss of capital. Past results are no guarantee of future results. Trading stocks and CFD's can yield large rewards, but also has large potential risks. Trading with leverage can be especially risky. You should be fully aware of the risks of trading in the capital markets. You are strongly advised not to trade with capital.
|