With the end of the third quarter here, and with the "best period of the year" right around the corner, I wanted to go back and look at where we were. By that I mean I wanted to assess the first nine months of the year before even thinking about where we might be three months from now. What we found wasn't surprising, but it's definitely worth discussing today. If there was ever a year for the market that made trading an incredibly attractive alternative to investing, then 2005 was it. Let's take a look. After that, we'll even throw in an active management idea that is still technically a buy-and-hold strategy, just for those who want to remain as passive as possible.
For the year, the S&P 500 is up 0.3% (yes, three tenths of a percent), the Dow is down 3%, and the NASDAQ is down 1.5%. Based on just those numbers alone, it hasn't exactly been a bearish year - just an uneventful one. And if you're a buy-and-hold kind of person, then it's not like you're exactly in the hole. That's good, right? However, the reality is that the year was incredibly eventful, full of trading opportunities that could have reaped big profits for those willing to take action. Rather than moving sideways, a decent trader could have spotted some major moves and been building some gains while others were spinning their wheels.
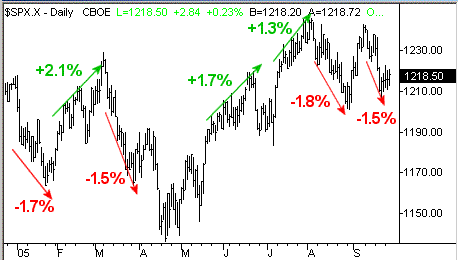
On the chart below we've pointed out the major swings (discernible and trade-able moves) for the S&P 500 over the last nine months. The upswings are in green, and the downturns are in red. While we're basically where we started, it's been a wild ride between then and now. Just take a look at the chart, then read below for why this is important.
S&P 500 with major swings, 2005 - Daily

You may have noticed right away that we didn't mark every swing or turn, or even start and stop at the beginning of each trend? Why? We're optimists, but we also have to be realistic. It's unlikely that even the best of traders would have spotted every swing, or found every top and bottom. Instead, we want to portray a realistic scenario and display the kinds of results that actually could have been captured. The thing is, even without being in every single major move, the potential gains were huge. With our conservative estimate, you still could have garnered 11.6% worth of movement (counting both the ups and downs) from the S&P 500. That sure beats the heck out of the SPX's buy-and-hold return of zilch for the year. But more than that, think about what you could have done with leveraged positions like options or futures, or even a leveraged mutual fund. It's not always like this (obviously), but this was a great time to be a trader, and a lousy time to be an investor.
Now don't get us wrong - we're not bashing long-term holdings. We're just discussing the downside of buy-and-hold that is too often swept under the rug. While those folks who are strict buy-and-hold investors aren't exactly in the hole in terms of portfolio value, you're definitely in the hole in terms of time. See, you guys and gals are one year closer to retirement (or college, or the second house, or whatever), but you're not one bit closer to attaining your goal....or meeting your need.
Is it a bit self serving to encourage you to learn to be a trader? Yeah, at least a little, but that's not our goal. We just want to pose a question that is applicable to a huge number of long-term portfolios......how many more flat nine-month periods can you go through? Even capturing half of the gains we saw above (which would be 5.8%) is better than banking nothing at all.
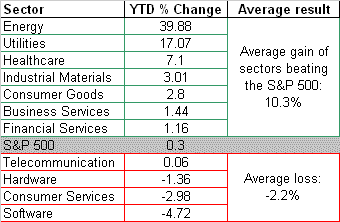
That said, you don't have to trade all the time to have a shot at beating the market. There's another way to outperform the averages - by picking the right sectors. Of the 10 major sectors that are represented in the S&P 500, how many would you think outperform the index? The most logical answer is the right one - usually half. Therefore, the other half usually underperform the index. If you can limit your buy-and-hold positions to the areas that are stronger than the average, then you've given yourself more of an edge than you may realize. Let's look at how this idea would have done for you this year......
Sector Returns - Year to Date

See the difference that can be made by focusing on the strong sectors and ignoring the troubled ones? If you had spread your portfolio out just among the sectors that were better than the market, you'd be up by 10.3% for the year. Again, that beats the heck out of the 0.3% gain you may have racked up in an index fund.
Now don't get us wrong - we know that nobody has the acumen to perfectly say at the beginning of any year which sectors will lead and lag. But even if you were only half right, you'd still be up around 5.1% year-to-date. It may have taken a little work and some maintenance, but finding these hot spots is something anybody could have done. More than that, it's something anybody can do in the future, and it would still let you think and act with a long-term approach.
Anyway, these are just a couple of ideas that illustrate the power of being proactive with your portfolio.
Price Headley is the founder and chief analyst of BigTrends.com.