| Corcoran Technical Trading Patterns For January 5 |
| By Clive Corcoran |
Published
01/5/2009
|
Stocks
|
Unrated
|
|
|
|
Corcoran Technical Trading Patterns For January 5
In the final days of 2008 the path of least resistance was upwards for global equities and this continued on Friday, the first trading day of 2009. Traders had little in the way of data to digest during the holiday period but this week will bring a number of reminders of the bleak state of the US economy, including the release of employment data on Friday.
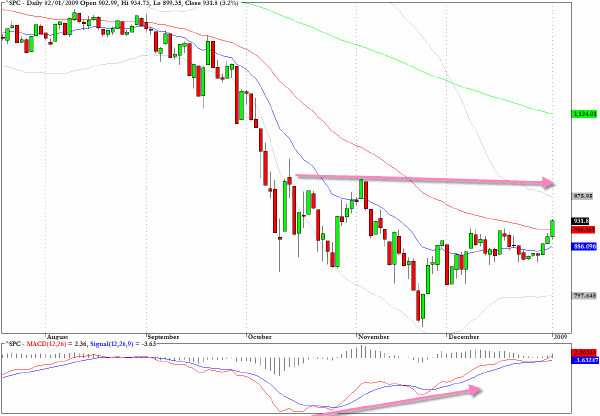
The underlying momentum dynamics, which are becoming more evident on the daily chart of the S&P 500, still favor the rally continuation and I would be targeting the area between 1000 and 1040 on this index before Inauguration Day.
The ride will, I suspect, not be smooth but there are probably enough traders convinced that a game-changing bottom is in place to keep the bears on the sidelines waiting for higher prices before the downside is robustly tested again.
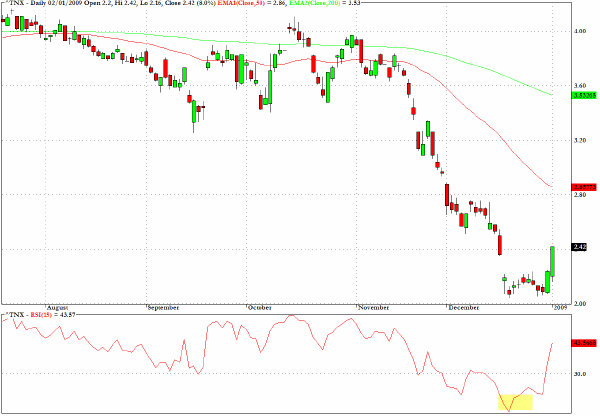
Readers may recall that my favorite chart from 2008 was the yield on the ten-year Treasury note and in my last commentary I pointed to the highly unusual condition where the RSI reading on the monthly chart had dropped to its lowest reading ever with yields in completely uncharted territory.
During the closing days of 2008 yields continued to flirt with the two percent level pushing the RSI readings to extremely overbought levels (in terms of price) but the rather severe reversal has restored the RSI level to more neutral territory.
I would not expect a mass exodus from the safety of Treasuries yet but this possibility will act as a restraining factor in terms of too much enthusiasm for other fixed income instruments and will at some point in the coming months pose a real question mark for those currently promoting an almost limitless period of "quantitative easing"
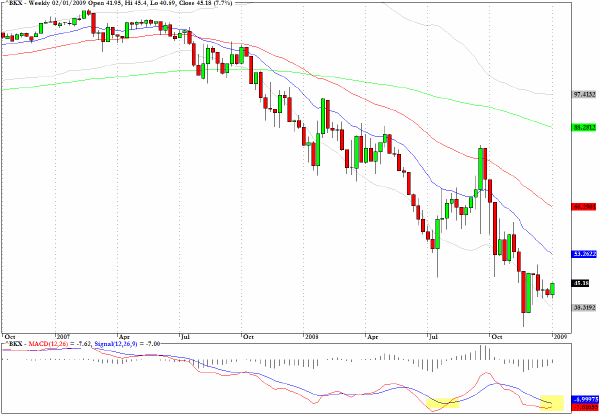
There are, for the first time, suggestions on the weekly chart for the KBW Banking Index (^BKX) that a momentum bottom is finally in place for the sector.
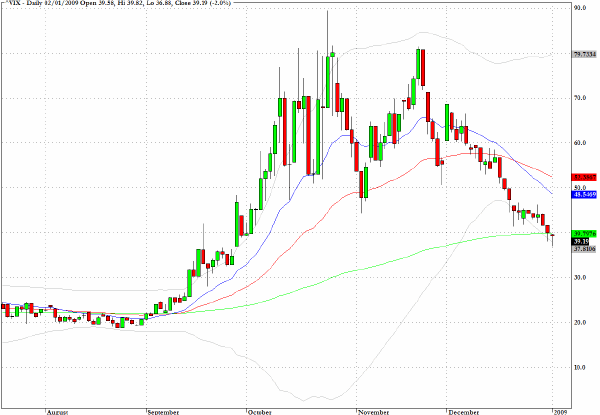
The CBOE Volatility Index (^VIX) has retreated to the 200-day EMA in the region of 40 and it is notable that despite Friday's three percent rally for many equity indices the VIX barely moved.
The fundamentals suggest that volatility should be a factor during the next few months as the manic/depressive quality to trading based upon sightings of the turnaround continue to be questioned by new dire news. Technically it seems unlikely that we should just slice our way through the 200-day EMA without a tendency to retest higher levels in the vicinity of 50.
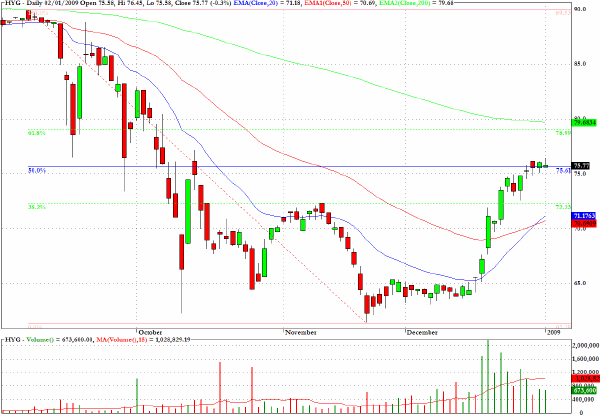
A couple of weeks ago I suggested that HYG, which tracks the high yield corporate bond market would seek out the target level suggested by the 50% retracement level that is visible on the chart below which also coincides with the October 14 reaction high to the big market sell off on October 10.
The large upward moves on high volume seen over the holiday period suggest that the very oversold condition that preceded this recent recovery move may have been partially alleviated. Further upside towards 80 which would represent the 62% retracement level as well as the 200-day EMA would represent a best case target in the near term.
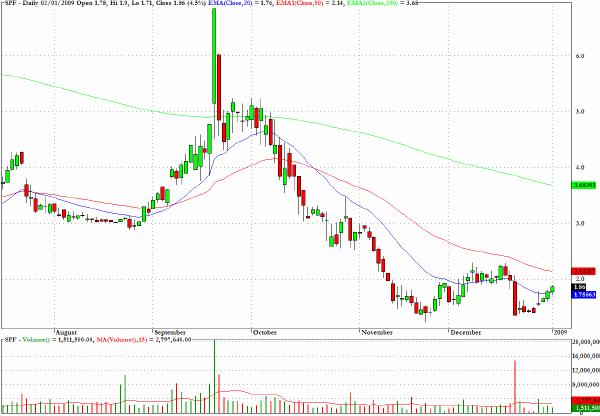
Standard Pacific (SPF) looks vulnerable to renewed weakness in the context of a bearish pullback pattern.
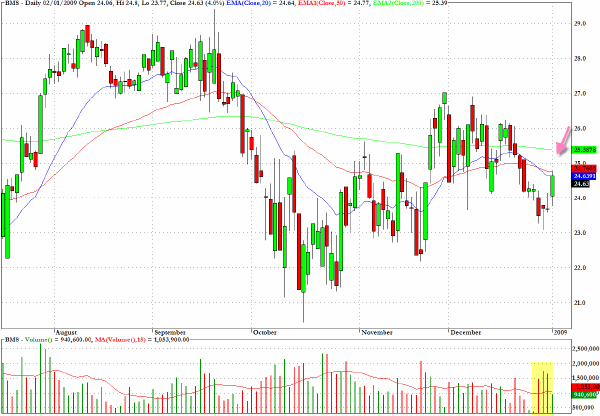
Based on the volume characteristics and overhead resistance I would favor a short position for Bemis (BMS)
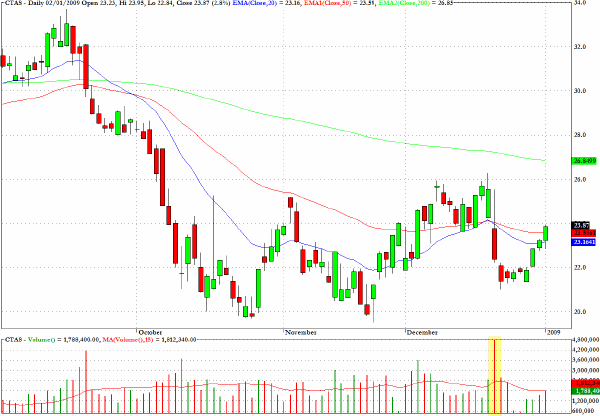
The daily chart for Cintas (CTAS) suggests that the stock could be vulnerable in the same manner as SPF above.
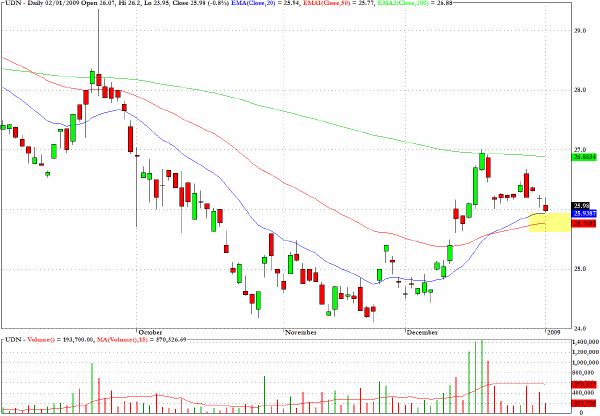
UDN, which takes an inverse position on the US dollar against a basket of major currencies, is approaching its 50-day EMA from above and an entry at this level may provide a short term trading opportunity for a pullback on the US currency.
Longer term I am beginning to have doubts about the sustainability of December's spike up in the euro and especially the Swiss Franc.
Clive Corcoran is the publisher of TradeWithForm.com, which provides daily analysis and commentary on the US stock market. He specializes in market neutral investing and and is currently working on a book about the benefits of trading with long/short strategies, which is scheduled for publication later this year.
Disclaimer
The purpose of this article is to offer you the chance to review the trading methodology, risk reduction strategies and portfolio construction techniques described at tradewithform.com. There is no guarantee that the trading strategies advocated will be profitable. Moreover, there is a risk that following these strategies will lead to loss of capital. Past results are no guarantee of future results. Trading stocks and CFD's can yield large rewards, but also has large potential risks. Trading with leverage can be especially risky. You should be fully aware of the risks of trading in the capital markets. You are strongly advised not to trade with capital.
|