| Corcoran Technical Trading Patterns For January 6 |
| By Clive Corcoran |
Published
01/6/2009
|
Stocks
|
Unrated
|
|
|
|
Corcoran Technical Trading Patterns For January 6
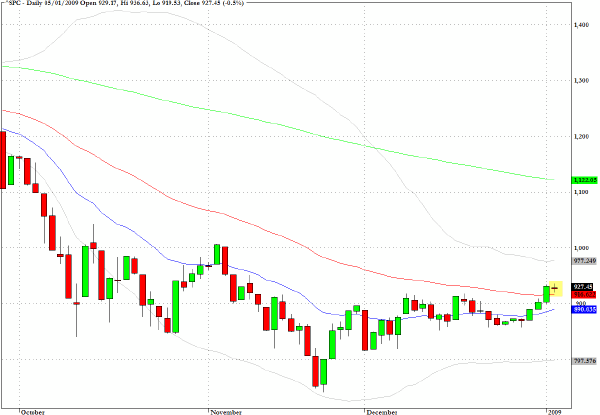
Yesterday's trading was very technically driven within a confined range as the volume began to kick in following the extended holiday period. The resultant tiny doji star formation adds further emphasis to the overall range compression that is evident on the chart.
There was a slight sell-side bias to the session but there was also the sense that the bulls were not about to turn and run after three consecutive positive sessions.
The constriction of the Bollinger bands suggests that a large directional move is on the horizon and the real question is whether traders will want to show their hands before this Friday's employment data or wait until the numbers are released. Anything less than a very bad number has, to use the folklore, already been "priced in".
The technical conditions are pointing to higher prices ahead but there is a sense that nearly everyone is expecting an upside surprise which would of course mean that it is no longer a surprise.
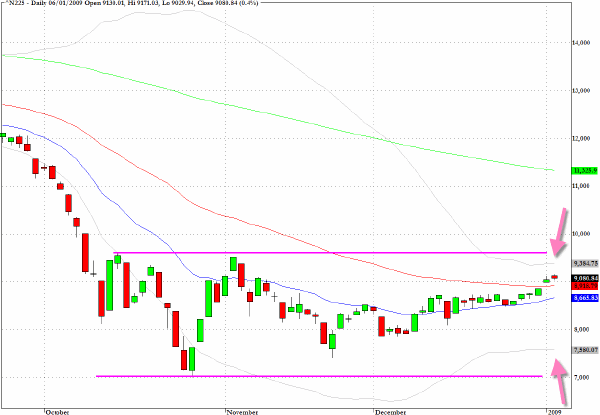
The Nikkei 225 (^N225) moved up marginally in trading in Tokyo on Tuesday and as with the chart above there is a compression characteristic which is surely the precursor to a decisive directional move.
A challenge to the October 15 intraday high just above 9600 seems to be a valid target in coming sessions.
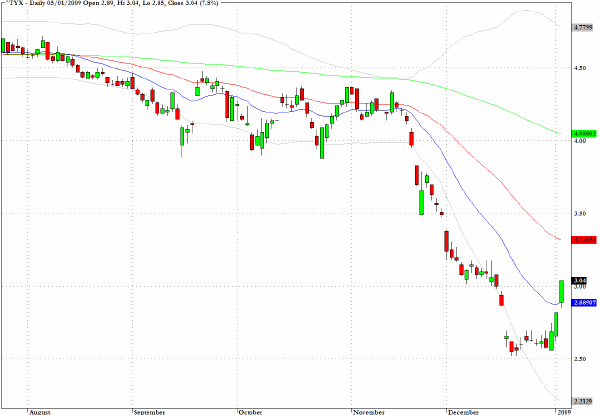
The sell-off in long term Treasuries continued yesterday with the largest jump in yields being seen at the far end of the yield spectrum. The 30-year bond now has surpassed the three percent yield threshold again and as the chart suggests a 3.3% yield would simply return us to the 50-day EMA.
The more acceptance there is that we have seen the turn in equities, the greater the willingness to take on more speculative asset classes, the more selling one would expect to see across the Treasury complex.
One benign consequence of this will be an improvement in the ability of banks to engage in the more traditional ways for them to make money - playing a steeper yield curve - without having to resort to the risks that beset more sophisticated financial engineering.
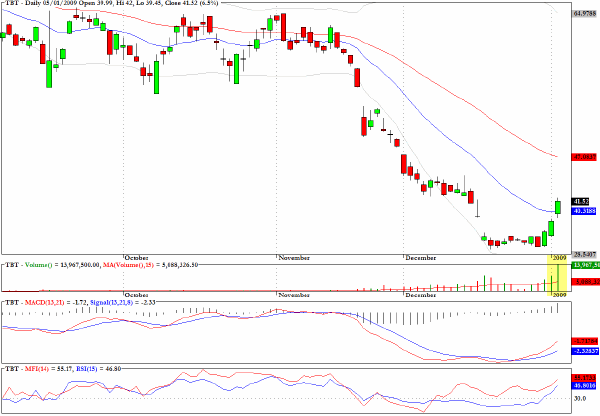
The chart for the exchange traded fund TBT mirrors the chart above as it is an inverse fund based upon price for long-term Treasuries.
A lot of money is now betting that the unprecedented downward moves in yields in December was overdone and, while this would seem to be a sound judgment in the intermediate term, timing in the short term, as always, can be hazardous to your P&L.
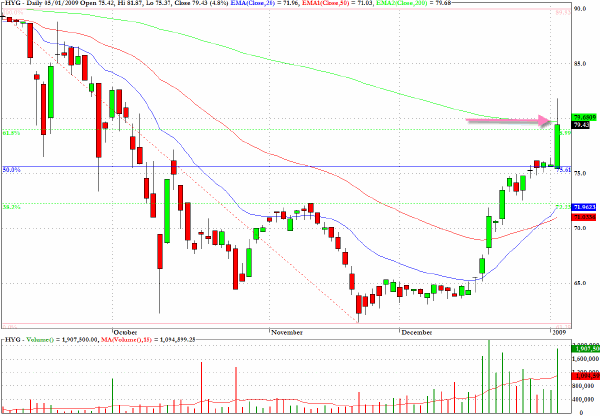
Yesterday I suggested that HYG, which tracks the high yield corporate bond market could have further upside towards 80 which would represent the 62% retracement level as well as the 200 day EMA... and that this would represent a best case target in the near term. I would certainly be looking to remove long positions and stalking the short side in coming sessions.
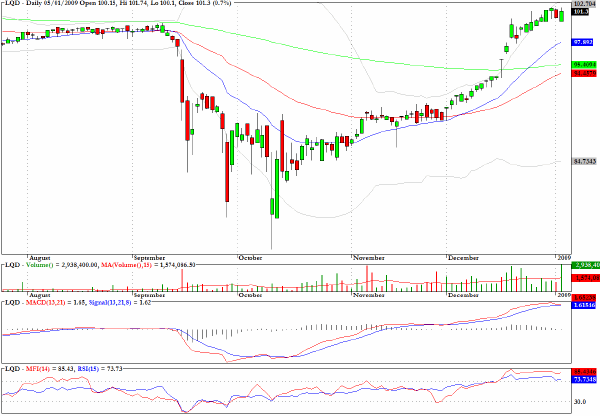
The investment grade corporate bond sector fund LQD has rallied back to its early September levels, even slightly above those levels, and could be ready to digest its gains while some trading profits are booked.
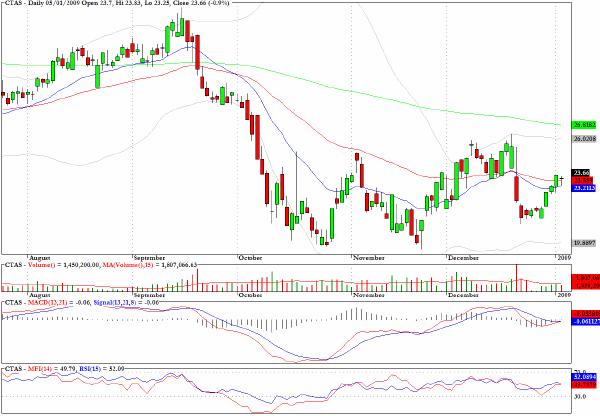
The daily chart for Cintas (CTAS) reveals a rather well formed bearish flag pattern.
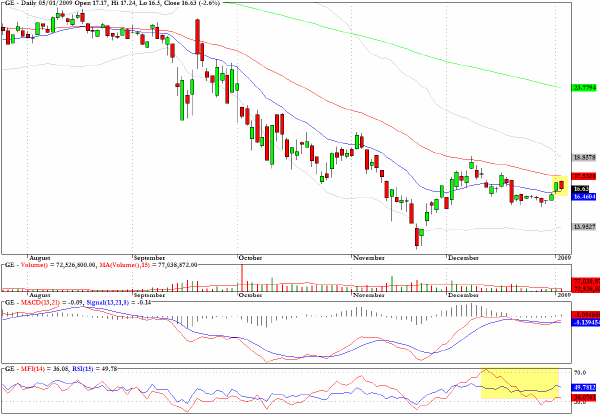
The chart for General Electric (GE) is one of the least healthy looking among the major Dow Jones components and yesterday there was a rejection at the 50-day EMA.
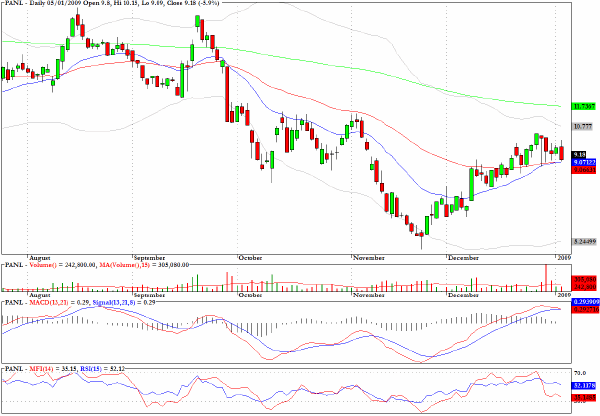
Universal Display (PANL) dropped almost six percent yesterday but may be expected to see a short-term bounce at the intersection of two key moving averages.
Clive Corcoran is the publisher of TradeWithForm.com, which provides daily analysis and commentary on the US stock market. He specializes in market neutral investing and and is currently working on a book about the benefits of trading with long/short strategies, which is scheduled for publication later this year.
Disclaimer
The purpose of this article is to offer you the chance to review the trading methodology, risk reduction strategies and portfolio construction techniques described at tradewithform.com. There is no guarantee that the trading strategies advocated will be profitable. Moreover, there is a risk that following these strategies will lead to loss of capital. Past results are no guarantee of future results. Trading stocks and CFD's can yield large rewards, but also has large potential risks. Trading with leverage can be especially risky. You should be fully aware of the risks of trading in the capital markets. You are strongly advised not to trade with capital.
|