| Corcoran Technical Trading Patterns For January 7 |
| By Clive Corcoran |
Published
01/7/2009
|
Stocks
|
Unrated
|
|
|
|
Corcoran Technical Trading Patterns For January 7
Yesterday's US session had many of the tight range characteristics of Monday's session, but with an initial upside bias that faded into the close. Release of the FOMC minutes may have dampened enthusiasm with its suggestion that the recovery may not be as imminent as some would like to believe.
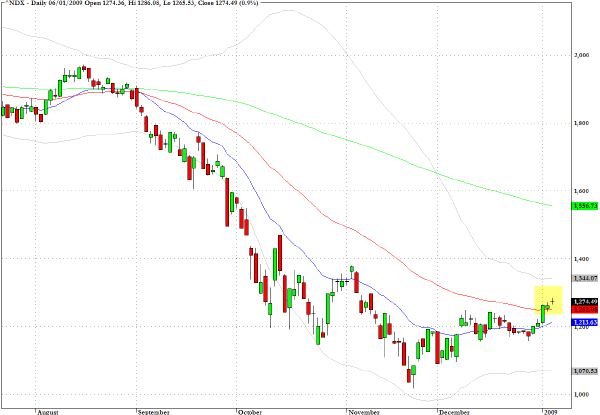
The QQQQ broke to a new high intraday, not seen since early November, but selling emerged late in the session to bring prices on the close more or less their levels on the gap up opening.
The tiny doji star on the chart for the Nasdaq 100 (^NDX) is the second in a row and coupled with the overall constriction of the volatility bands underlines the mounting probability that a big move lies ahead. Although I am deliberately going to remain mute on my hunches, it would not be surprising to see that the first move could be a fake out to the eventual break away.
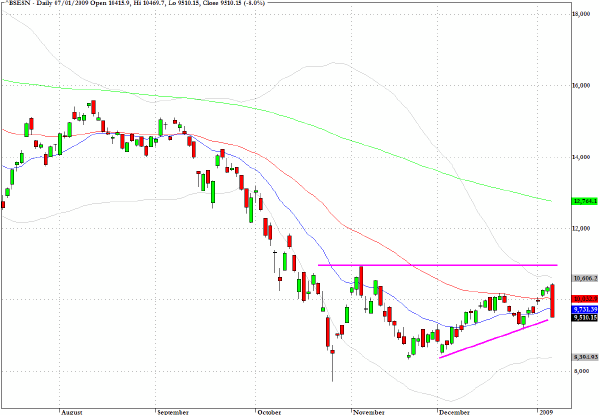
Speculative sentiment regarding emerging markets has taken a hit this morning with the plunge in the Mumbai Sensex index (^BSESN). The seven percent drop that followed the disclosure by Satyam that there were fictitious assets on its books is yet another Madoff moment for those who are trying to re-assert a more adventurous approach to asset investing rather than hiding out in US Treasuries.
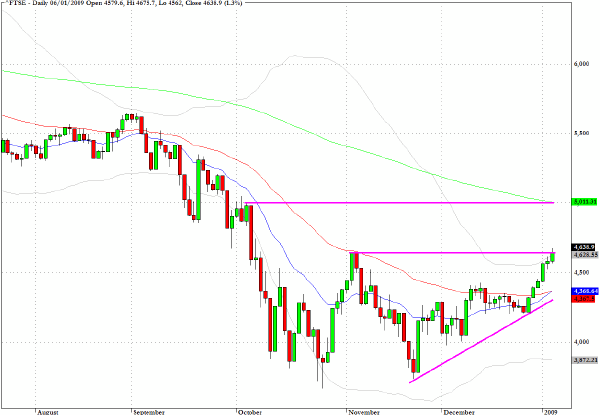
London’s FTSE has retreated from the recent gains after running into the resistance indicated on the chart below. From a longer term perspective we should expect an attempt to absorb more serious overhead supply which will emerge in the region of 5000.
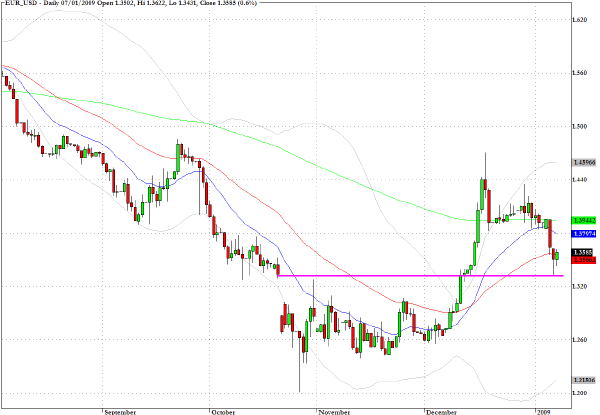
The euro found support in Monday's trading at the $1.33 level which has been pivotal during the last three months. I will be looking for further evidence, in today's session, that the struggle to regain traction above $1.35 could provide a short term opportunity on the long side.
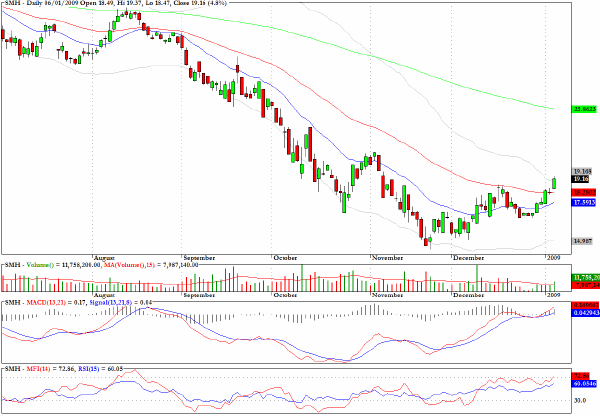
The chart for SMH, an exchange traded fund for the semiconductor sector, looks too obviously to have broken away from its basing pattern and I would be wary on the long side.
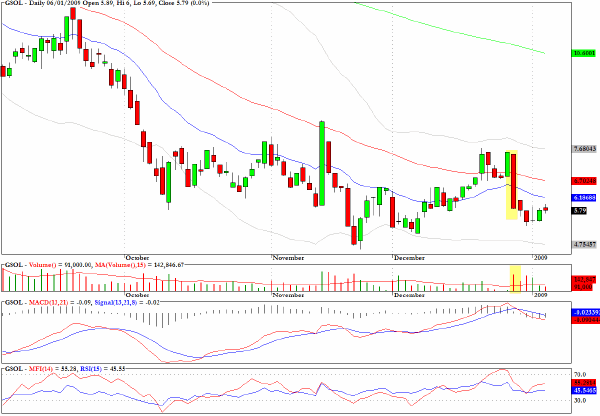
Global Sources (GSOL) has a bearish flag pattern.
Gilead Sciences (GILD) could pullback further towards $48 at which point it would be attractive on the long side.

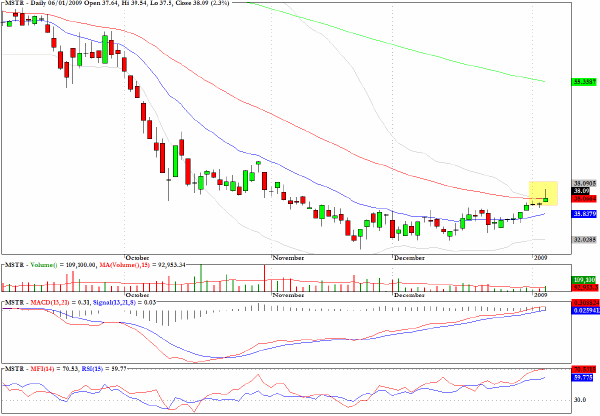
The long upper tail on the chart of Microstrategy (MSTR) which coincides with the 50-day EMA could be the precursor to a tradable setback.
Clive Corcoran is the publisher of TradeWithForm.com, which provides daily analysis and commentary on the US stock market. He specializes in market neutral investing and and is currently working on a book about the benefits of trading with long/short strategies, which is scheduled for publication later this year.
Disclaimer
The purpose of this article is to offer you the chance to review the trading methodology, risk reduction strategies and portfolio construction techniques described at tradewithform.com. There is no guarantee that the trading strategies advocated will be profitable. Moreover, there is a risk that following these strategies will lead to loss of capital. Past results are no guarantee of future results. Trading stocks and CFD's can yield large rewards, but also has large potential risks. Trading with leverage can be especially risky. You should be fully aware of the risks of trading in the capital markets. You are strongly advised not to trade with capital.
|