| The McMillan Options Strategist Weekly |
| By Lawrence G. McMillan |
Published
01/9/2009
|
Options
|
Unrated
|
|
|
|
The McMillan Options Strategist Weekly
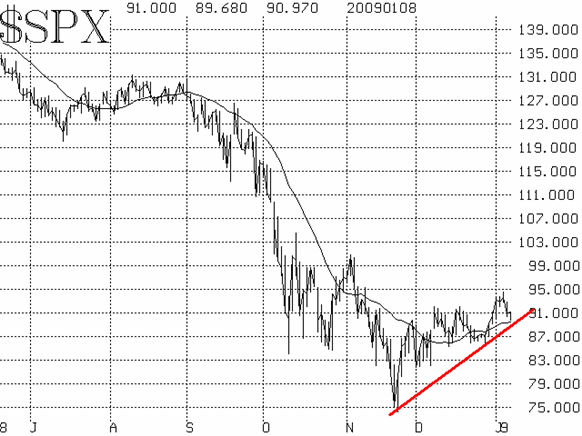
The new year started out in bullish fashion, with $SPX breaking out over the 920 resistance area. This turned the $SPX chart bullish once again. An upward trend line connecting the November and December bottoms is operative at this time. As long as $SPX remains above the upward trending line, the chart is bullish. The rising 20-day moving average is also in the same area -- at about $SPX 880, currently. If that level should be violated, it would throw the chart back into a trading range scenario, which we would view as mildly bullish. The chart would only turn bearish if the support at $SPX 850-860 were violated.

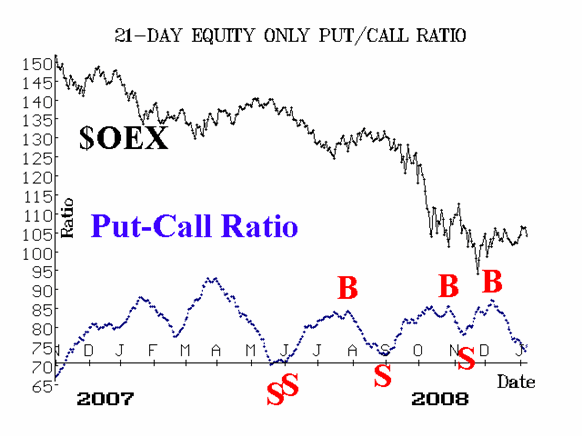
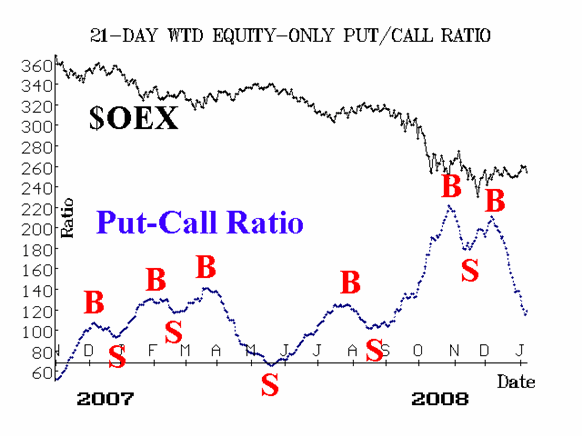
Equity-only put-call ratios have continued to remain on buy signals since they were first issued about a month ago. During that time, the ratios have declined steadily, and now they are nearing the lower regions of their charts. We prefer not to anticipate a change in signal, however, and so the bottom line is that as long as these ratios continue to decline, that is bullish for the market.

Perhaps the mostly startling area is breadth. We have often said that it is necessary for breadth to expand into overbought conditions at the beginning of a new bullish market phase. That condition has certainly been satisfied. While such an overbought condition may mean that the market has to pause a bit to work it off, it is nevertheless bullish in that it shows how broad this rally is.

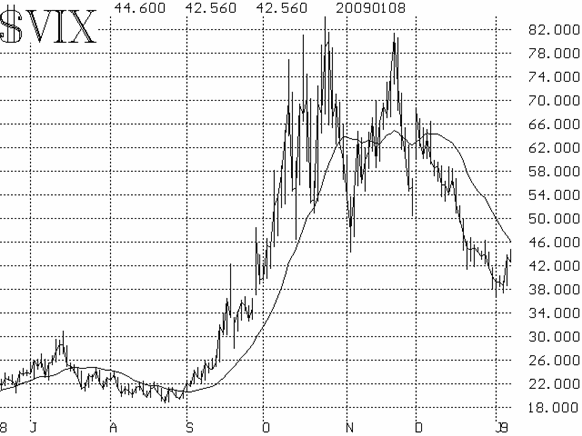
Volatility indices ($VIX and $VXO) have continued to decline, and that is bullish. The fact that both jumped higher in Wednesday's decline is not significant (see chart, Figure 4). $VIX would have to rise above its 20-day moving average in order to violate the current bullish downtrend; that would entail a move to 46-47 or so, which we do not envision at this time.

In summary, we continue to view this market as bullish. Progress is, at times, difficult, but with the indicators generally bullish, we expect higher prices over the short term.
Lawrence G. McMillan is the author of two best selling books on options, including Options as a Strategic Investment, recognized as essential resources for any serious option trader's library.
|